<center>
# Unix System Monitoring and Diagnostic CLI Tools
*Originally published 2020-09-01 on [blog.sweeting.me](https://docs.sweeting.me/s/blog), updated sporadically since then.*
*Also published on the [Monadical Blog](https://monadical.com/posts/system-monitoring-tools.html), [HackerNews](https://news.ycombinator.com/item?id=24344520), and [ /r/Sysadmin](https://www.reddit.com/r/sysadmin/comments/ikynyo/an_opinionated_list_of_system_monitoring_and/).*
<img src="https://docs.monadical.com/uploads/upload_8293c5cdcc3cf0dc6a6024ea0b18a2ee.png" style="width: 70%; border-radius: 4px; border: 1px solid #ccc; box-shadow: 4px 4px 4px rgba(0,0,0,0.08)">
<br/><br/>
*An opinionated list of CLI utilities for monitoring and inspecting Linux/BSD systems.*
*A similar list is available for macOS here: [awesome-macos-command-line](https://git.herrbischoff.com/awesome-macos-command-line/about/).*
</center>
<hr/>
[TOC]
---
## Getting Started
**CLI Usage Reference Tools:**
- https://linux.die.net/man/
- https://explainshell.com/ ([Github](https://github.com/idank/explainshell))
- https://tldr.sh/
- http://bropages.org/
- https://terminaltrove.com/
- https://github.com/chrisallenlane/cheat
- https://regex101.com/
- https://wiki.tilde.fun/admin/linux/cli/start
- https://github.com/rothgar/awesome-tuis
- https://github.com/toolleeo/cli-apps
- https://github.com/agarrharr/awesome-cli-apps
**My own personal helper script collections for Bash & Fish + reading lists & resources:**
- https://github.com/pirate/bash-utils
- https://github.com/pirate/fish-utils
**Guides:**
- https://github.com/jlevy/the-art-of-command-line
- http://www.brendangregg.com/linuxperf.html
- https://www.tecmint.com/command-line-tools-to-monitor-linux-performance/
- https://www.thegeekstuff.com/2011/03/linux-performance-monitoring-intro/
- https://www.opsdash.com/blog/disk-monitoring-linux.html
- https://www.binarytides.com/linux-commands-monitor-network/
- https://www.cyberciti.biz/faq/network-statistics-tools-rhel-centos-debian-linux/
**[And More...](#Further-Reading)**
Below is a collection of CLI tools that I've personally used while doing Linux/BSD systems administration over the past 10+ years. Some of them I use daily, others I only use once a year or less... but when I need them, boy am I glad they exist!
- `⭐️` I've added a star next to utilities that I find to be extremely well-built or well-suited to solving their particular task
- `🌈` Utiltities marked with a rainbow have glorious xterm256/full-color output
On non-Ubuntu/Debian-based Linuxes you should replace any instance of `apt install xyz` below with `pkg install xyz`/`brew install xyz`/`yum install xyz`/`nix install xyz`/etc. depending on your respective system.
If you would like to suggest changes/additions to this list you can comment on [Reddit](https://www.reddit.com/r/sysadmin/comments/ikynyo/an_opinionated_list_of_system_monitoring_and/), ping me on Twitter [`@theSquashSH`](https://twitter.com/theSquashSH), or find my contact email on [sweeting.me](https://nicksweeting.com).
---
## All-in-one tools
### `glances` ⭐️ 🌈
`htop`, `iftop`, `iotop`, `gpustat`, `ctop`, and more, all rolled into one tool.
Prints pretty much everything you need to know at a glance, including container resource usage, active processes, network and disk IO usage, and other stats.
```bash
pip install 'glances[action,browser,cloud,cpuinfo,docker,export,folders,gpu,graph,ip,raid,snmp,web,wifi]'
# launch glances CL
glances
# start a webserver to view glances output in a web UI on http://0.0.0.0:8787/
glances -w -B 0.0.0.0 -p 8787
```
- https://github.com/nicolargo/glances
- https://glances.readthedocs.io/en/stable/cmds.html
- https://opensource.com/article/19/11/monitoring-linux-glances
### `nmon` 🌈
Jack-of-all-trades tool similar to `glances`, but with an interactive CLI UI to switch between panes for each type of resource.
```bash
# run nmon then press c/m/r/etc to enable/disable each pane in the ncurses UI
nmon
```
- http://nmon.sourceforge.net/pmwiki.php
- https://www.admin-magazine.com/HPC/Articles/Nmon-All-Purpose-Admin-Tool
- https://www.tecmint.com/nmon-analyze-and-monitor-linux-system-performance/
- https://www.techrepublic.com/article/how-to-monitor-your-linux-servers-with-nmon/
### `dstat`
A minimalist utility that prints a colored one-line summary of system stats every second.
```bash
# give an update of cpu, disk, and network usage every 5sec
dstat -cdn 5
# show advanced cpu, filesystem, ipc, locking, and asyncio stats every 2sec
dstat --cpu-adv --fs --aio --ipc --lock 2
```
- https://www.sanfoundry.com/5-dstat-command-usage-examples-in-linux/
- https://www.tecmint.com/dstat-monitor-linux-server-performance-process-memory-network/
- https://www.geeksforgeeks.org/dstat-command-in-linux-with-examples/
- https://www.networkworld.com/article/3291616/examining-linux-system-performance-with-dstat.html
### ~~`atop`~~
:::danger
**POTENTIALLY COMPROMISED? ☠️ ... `glances` is a good alternative for now**
https://rachelbythebay.com/w/2025/03/25/atop/
:::
Great for finding out what's causing system-wide slowness when you're not sure whether what the culprit is (e.g. CPU/disk/network/temperature/hardware/etc.).
Ranks all possible sources of slowness independent of individual processes, highlights potential bottlenecks or high resource usage areas in red. Very useful when you can't tell what's causing slowness from `htop` alone.
```bash
apt install atop
# show all processes and individual threads
atop -y
```
- https://github.com/Atoptool/atop
- https://linux.die.net/man/1/atop
- https://haydenjames.io/use-atop-linux-server-performance-analysis/
### `tiptop` 🌈
tiptop is a command-line system monitoring tool in the spirit of top. It displays various interesting system stats and graphs them. Works on all operating systems.
```bash
pip install tiptop
tiptop
```
- https://github.com/nschloe/tiptop

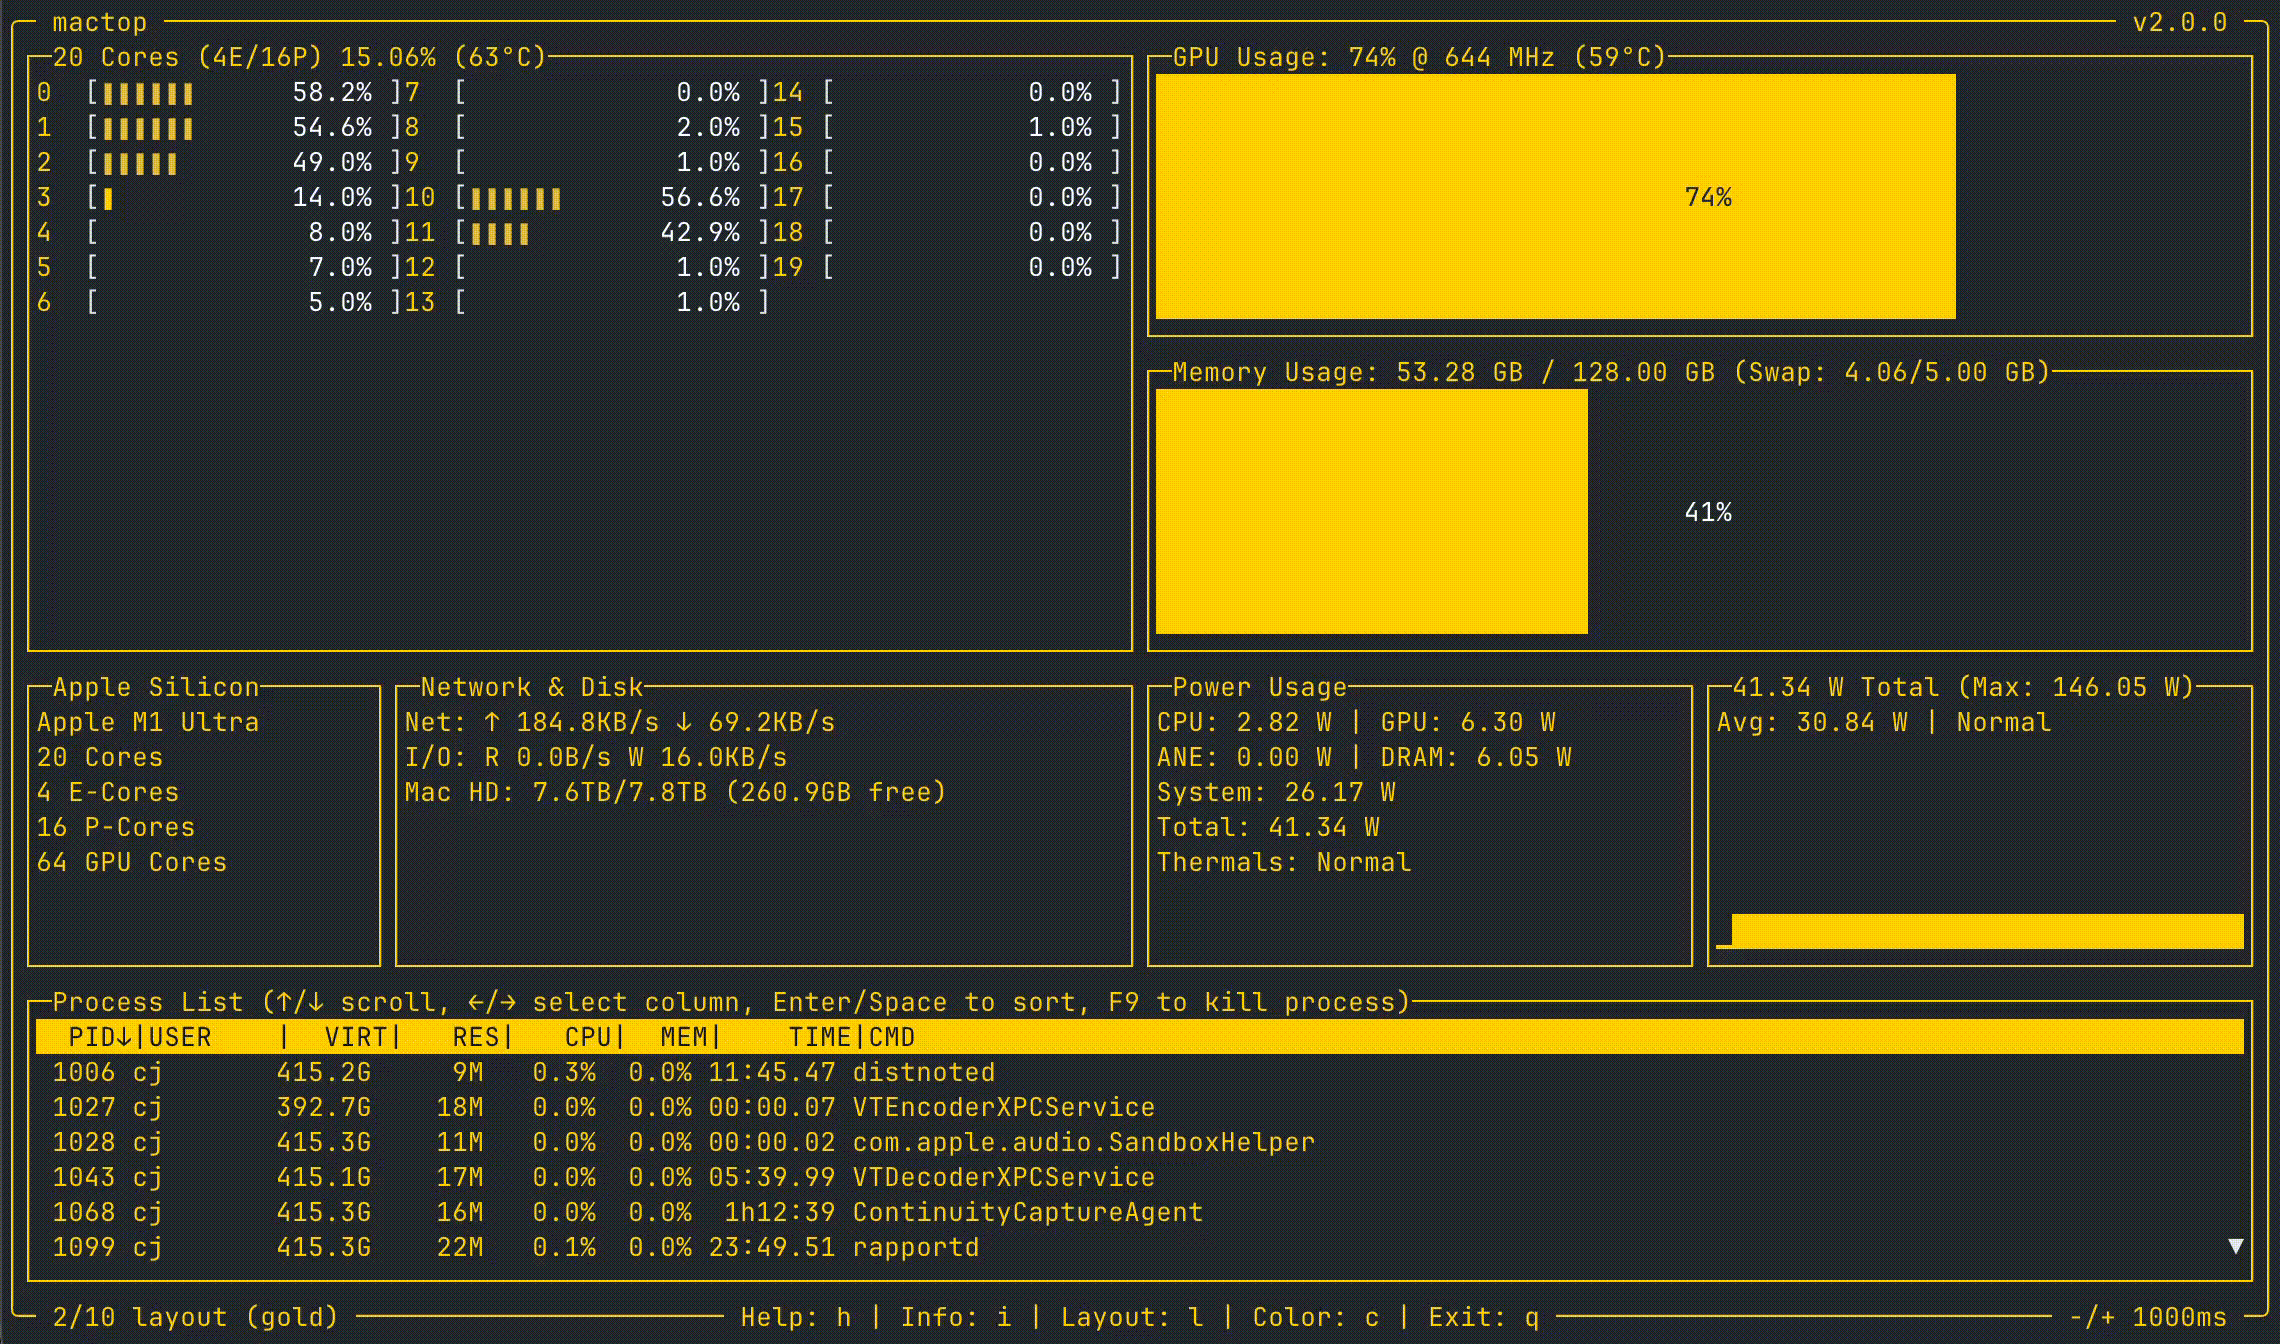
### `mactop` 🌈
Two identially named but separate projects that provide macOS / Apple Silicon monitoring.
```bash
brew install mactop
mactop
```
- https://github.com/metaspartan/mactop
- https://github.com/laixintao/mactop
### `osquery` ⭐️
Run SQL queries on your system setup and resources.
```bash
# show all processes listening on local ports
osqueryi "SELECT DISTINCT
process.name,
listening.port,
process.pid
FROM processes AS process
JOIN listening_ports AS listening
ON process.pid = listening.pid
WHERE listening.address = '0.0.0.0'"
# show all gateway routes to the internet in json format
osqueryi --json "SELECT * FROM routes WHERE destination = '::1'"
# show number of threads by process name
osqueryi 'SELECT count(pid) AS total, name FROM processes GROUP BY name ORDER BY total desc LIMIT 10'
```
- https://osquery.io/
- https://blog.rapid7.com/2016/05/09/introduction-to-osquery-for-threat-detection-dfir/
- https://osquery.readthedocs.io/en/stable/introduction/sql/
### `sar`
```bash
apt install sysstat
echo 'ENABLED="true"' > /etc/default/sysstat
systemctl restart sysstat
# print all basic stats every 1sec
sar -A 1
# show network stats by interface/device every 2sec
sar -n DEV 2
# show all available stats every 1sec
sar -B -b -d -I ALL -m ALL -n ALL -q -r ALL -S -u ALL -v -W -w -y 1
```
- https://kirelos.com/how-to-install-and-configure-sysstat-on-ubuntu-20-04/
- https://www.linuxtechi.com/generate-cpu-memory-io-report-sar-command/
- https://www.poftut.com/linux-sysstat-utilities-monitoring-system-performance/
- https://www.thegeekstuff.com/2011/03/sar-examples/
- https://github.com/sysstat/sysstat
### `landscape-sysinfo`
Ubuntu's builtin system status summary tool that displays whenever you SSH in.
```bash
landscape-sysinfo
```
### `webmin`/`cockpit` ⭐️ 🌈
Web GUI system control panels.
```bash
curl -fsSL 'http://www.webmin.com/jcameron-key.asc' | apt-key add -
echo "deb http://download.webmin.com/download/repository/ sarge contrib" \
"deb http://webmin.mirror.somersettechsolutions.co.uk/repository/ sarge contrib" | tee /etc/apt/sources.list.d/webmin.list
apt install webmin
apt update
```
- https://webmin.com/
---
## CPU / Memory
### `lscpu`
Show info about the available CPU slots and installed CPUs.
```bash
apt install util-linux
lscpu
```
- https://manpages.ubuntu.com/manpages/focal/man1/lscpu.1.html
- https://www.howtoforge.com/linux-lscpu-command/
### `lsmem`
Show info about the available RAM slots and installed chips.
```bash
apt install util-linux
lsmem -a
```
- https://manpages.ubuntu.com/manpages/focal/en/man1/lsmem.1.html
- https://zoomadmin.com/HowToLinux/LinuxCommand/lsmem
### `top`
Barebones process resource usage monitoring.
```bash
apt install top
top
```
- https://linux.die.net/man/1/top
- https://www.thegeekstuff.com/2010/01/15-practical-unix-linux-top-command-examples/
### `htop` ⭐️ 🌈
A better version of `top`.
```bash
apt install htop
htop
```
- https://linux.die.net/man/1/htop
- https://www.deonsworld.co.za/2012/12/20/understanding-and-using-htop-monitor-system-resources/
- https://www.thegeekstuff.com/2011/09/linux-htop-examples/
- https://devanswers.co/ubuntu-system-monitoring-with-htop/
### `mpstat`
Show per-core CPU usage statistics including IO load, interrupt load, system load, user load, etc. Gets its data from `/proc/stat`.
```bash
apt install sysstat
# show all stats every 1sec
mpstat -A 1
# show utilization of all processors on the system every 1sec
mpstat -P ALL 1
```
- https://manpages.ubuntu.com/manpages/focal/man1/mpstat.1.html
- https://www.linuxnix.com/7-mpstat-command-examples-in-linux/
### `btop++` ⭐️ 🌈
```bash
# install btop from github
btop
```
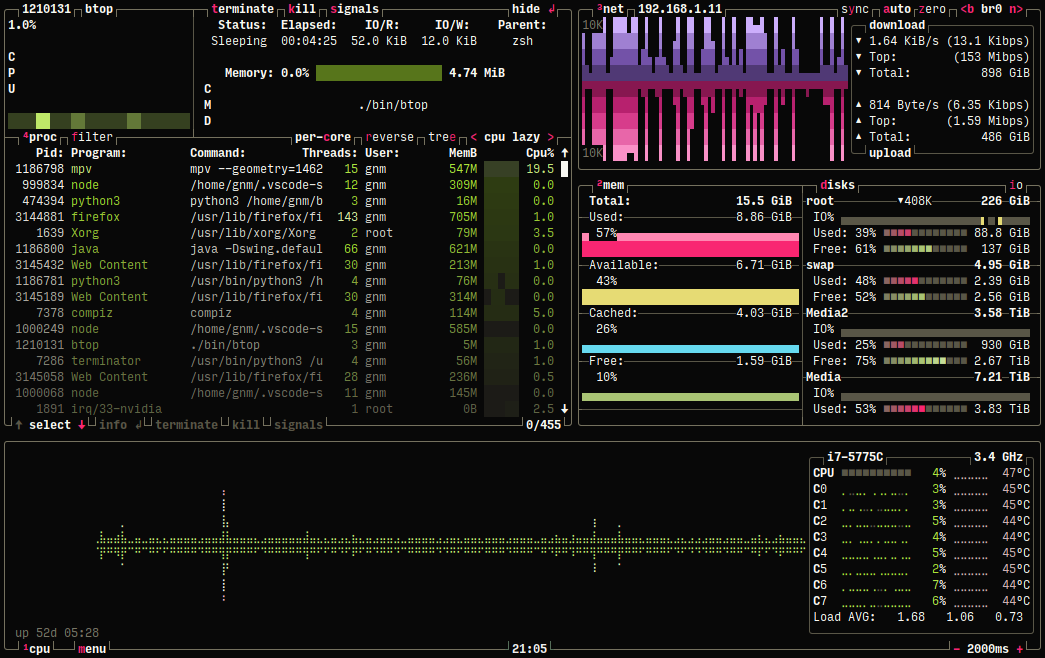
https://github.com/aristocratos/btop
### `pidstat`
Show per-process CPU usage statistics including IO load, interrupt load, wait time, etc. Gets its data from `/proc/<pid>/stat`.
```bash
apt install sysstat
# show stats for each pid with human-readable sizes and full commands w/ args
pidstat --human -l
# show reports of page faults and memory statistics for PID 1234 every 2sec
pidstat -r -p 1234 2
```
- https://manpages.ubuntu.com/manpages/focal/en/man1/pidstat.1.html
- https://www.thegeekstuff.com/2014/11/pidstat-examples/
- https://linoxide.com/linux-command/linux-pidstat-monitor-statistics-procesess/
### `free`
Show RAM and SWAP usage information.
```bash
# show RAM and SWAP usage info along with buffer/cache stats and totals
free -h -t -l
```
- https://manpages.ubuntu.com/manpages/focal/en/man1/free.1.html
- https://www.howtoforge.com/linux-free-command/
- https://linuxize.com/post/free-command-in-linux/
### `vmstat`
Show virtual memory, buffer, cache, and paging information.
```bash
apt install sysstat
# show all virtual memory stats in megabytes every 1sec
vmstat -S M -a 1
# show aggregate statistics and totals
vmstat -s
# show disk-related virtual memory access statistics
vmstat -d
```
- https://linux.die.net/man/8/vmstat
- https://www.linode.com/docs/uptime/monitoring/use-vmstat-to-monitor-system-performance/
- https://www.tecmint.com/linux-performance-monitoring-with-vmstat-and-iostat-commands/
### `tsubame` 🌈
- https://github.com/DoranekoSystems/Tsubame
### `memray` 🌈
Fancy memory profiling TUI for python. It can track memory allocations in Python code, in native extension modules, and in the Python interpreter itself.
- https://github.com/bloomberg/memray
- https://github.com/laixintao/flameshow (flamegraph viewer)
---
## GPU
### `gpustat`
(Only works for NVidia GPUs.)
```bash
pip install gpustat
# print GPU performance stats with color every second
watch -c gpustat -cp --color
```
- https://github.com/wookayin/gpustat
### `intel_gpu_top`
Show GPU usage stats for Intel, NVidia, or Radeon GPUs.
```bash
apt install intel-gpu-tools
intel_gpu_top
```
- https://gitlab.freedesktop.org/drm/igt-gpu-tools
- https://manpages.ubuntu.com/manpages/focal/en/man1/intel_gpu_top.1.html
### `nvtop`
```bash
apt install nvtop
nvtop
```
- https://github.com/Syllo/nvtop
- https://manpages.ubuntu.com/manpages/focal/en/man1/nvtop.1.html
### `radeontop`
```bash
apt install radeontop
radeontop
```
- https://github.com/clbr/radeontop
- https://manpages.ubuntu.com/manpages/focal/en/man1/radeontop.1.html
### `nvidia-smi`
Monitor NVidia hardware sensor values (e.g. temperature, frequency, etc.).
```bash
apt install nvidia-smi
# print nvidia performance and sensor stats every second
nvidia-smi -l 1
# print nvidia utilization stats for GPU 0 every second
nvidia-smi -q -g 0 -d UTILIZATION -l 1
```
- https://developer.nvidia.com/nvidia-system-management-interface
- https://subscription.packtpub.com/book/programming/9781788996242/app01/app01sec01/useful-nvidia-smi-commands
- https://www.microway.com/hpc-tech-tips/nvidia-smi_control-your-gpus/
- https://developer.download.nvidia.com/compute/DCGM/docs/nvidia-smi-367.38.pdf
### `glmark2`
Stress-test GPU performance.
```bash
apt install glmark2
glmark2
```
- https://github.com/glmark2/glmark2
- https://linuxreviews.org/Glmark2
- https://manpages.ubuntu.com/manpages/focal/man1/glmark2.1.html
- https://www.howtoforge.com/tutorial/linux-gpu-benchmark/
- https://wiki.archlinux.org/index.php/Benchmarking
### `glxgears`
Stress-test GPU performance.
```bash
apt install mesa-utils
glxgears
```
- https://linux.die.net/man/1/glxgears
- https://www.howtoforge.com/tutorial/linux-gpu-benchmark/
- https://wiki.archlinux.org/index.php/Benchmarking
---
## Filesystem
### `iotop` ⭐️
Ranks processes by disk IO usage and throughput in realtime.
### `ioping`
Check the response time of a given device or socket. <1ms times with low variance are indicators of a healthy storage device.
```bash
apt install ioping
ioping /dev/sda
```
### `lsof` ⭐️
View processes actively reading/writing/locking a given path or device.
```bash
lsof +D /some/path/here
# see which processes are actively using a connected USB drive
lsof +D /media/usb
# see which processes are actively using nvidia GPUs
lsof /dev/nvidia*
```
### `fuser`
View processes actively reading/writing/locking a given directory or path.
```bash
fuser -a -v -u /some/path/here
```
### `blktrace`
Prints all disk-read events happening on the system.
```bash
sudo blktrace -d /dev/nvme0n1 -a read -o - | blkparse -i -
```
- https://questdb.io/blog/investigating-linux-phantom-disk-reads/
### `debugfs`
Translate between block numbers, inode numbers, and file paths.
```bash
debugfs -R 'icheck 536514808' /dev/nvme0n1
# debugfs 1.46.5 (30-Dec-2021)
# Block Inode number
# 536514808 8270377
debugfs -R 'ncheck 8270377' /dev/nvme0n1
# debugfs 1.46.5 (30-Dec-2021)
# Inode Pathname
# 8270377 /home/ubuntu/.questdb/db/table_name/2022-10-04/symbol_col9.d.1092
```
- https://questdb.io/blog/investigating-linux-phantom-disk-reads/
### `iostat`
View IO usage stats and avg response times for a given drive in realtime.
```bash
# show io stats in human readable sizes for all devices
iostat -d -m
# show extended stats (w/ human readable sizes) for /dev/sda every 1sec
iostat -d -m -x 1 /dev/sda
```
`d_await` is the avg time it took to respond to IO in ms (lower is better)
`%util` is the percent utilization (lower is better)
- https://www.geeksforgeeks.org/iostat-command-in-linux-with-examples/
- https://www.thegeekstuff.com/2011/07/iostat-vmstat-mpstat-examples/
- https://linoxide.com/linux-command/linux-iostat-command/
- https://www.linuxtechi.com/monitor-linux-systems-performance-iostat-command/
### `zpool iostat` ⭐️
View realtime ZFS IO stats for a pool.
```bash
zpool iostat -v poolnametotest 1
```
### `nfsiostat`
View realtime NFS IO stats.
```bash
apt install nfs-common
# show NFS IO stats sorted by operations per second every 1sec
nfsiostat -s 1
# show NFS IO stats for the mount /mnt/nfs-drive
nfsiostat /mnt/nfs-drive
```
- https://manpages.ubuntu.com/manpages/focal/man8/nfsiostat.8.html
- https://www.thegeekdiary.com/understanding-the-nfsiostat-command-output-examples-included/
### `cifsiostat`
View realtime CIFS IO stats.
```bash
apt install sysstat
# show human-readable CIFS IO stats in megabytes every 1sec
cifsiostat -h -m 1
```
- https://manpages.ubuntu.com/manpages/focal/en/man1/cifsiostat.1.html
- https://zoomadmin.com/HowToLinux/LinuxCommand/cifsiostat
- https://github.com/sysstat/sysstat
### `hdparm`
One-off command to test disk read/write speed.
```bash
hdparm -Tt /dev/sda
```
### `bonnie++`
One-off command to test disk read/write speed at a variety of block sizes.
```bash
# bonnie++ -d [TEST_LOCATION] -s [TEST_SIZE] -n 0 -m [TEST_NAME] -f -b -u [USER]
# simple example with a 1 gigabyte test file on /media/somedisk
bonnie++ -d /media/somedisk -s 1G ...
# full example with a 4 gigabyte test file on
bonnie++ -d /media/somedisk -s 4G -n 0 -m TEST -f -b
```
### `dd` ⭐️
The jack-of-all-trades tool `dd` can also be used for simple disk speed tests.
```bash
# create a ramdisk with a large test file in it
# this is needed to avoid being CPU or disk-speed limited
# when reading our random test data to write during the test
mkdir /mnt/ramdisk
mount -t tmpfs -o size=1024m tmpfs /mnt/ramdisk
dd if=/dev/urandom of=/mnt/ramdisk/testfile bs=1M count=1024 status=progress
# to test the write speed of a disk
sync
dd if=/mnt/ramdisk/testfile of=/mnt/disktotest/testfile bs=1M count=1024 oflag=dsync status=progress
# to test the read speed of a disk
echo 3 > /proc/sys/vm/drop_caches
dd if=/mnt/disktotest/testfile of=/dev/null bs=1M count=1024 status=progress
```
### `rsync`/`rclone`/`rsnapshotd`/`sanoid`+`syncoid`
Backup and file syncing tools.
```bash
apt install rclone rsync rsnapshotd
# sync some local files to a remote server over ssh/rsyncd
rsync --archive --info=progress2 /some/local/path user@host:/some/remote/path
# sync some local files to a remote directory on a cloud storage provider
rclone sync source:path dest:path [flags]
# mount remote dir as a local FUSE filesystem
rclone mount remote:path/to/files /path/to/local/mount
# take an rsync+hardlink snapshot of all the sources set in /etc/rsnapshot.conf
rsnapshot
# or take a zfs snapshot of a given pool/dataset
zfs snapshot -r poolname/dataset@snapshotname
```
### `gddrescue`/`dd_rescue`/`ddrescue-gui`/`recoverdisk`/`safecopy`/`recoverypy`
- https://askubuntu.com/questions/211578/whats-the-difference-between-ddrescue-gddrescue-and-dd-rescue
- https://github.com/PabloLec/RecoverPy 🌈
### `df`
Show the space available on a given filesystem.
```bash
df -h /
```
### `ncdu` ⭐️🌈
Analyze a directory to find all the largest files.
```bash
# show tree of largest files and dirs on / filesystem
ncdu -x /
# show tree of largest files and dirs in all filesystems below /mnt
ncdu /mnt
```
### `find`
```bash
# list files ordered by modified date from most recent to least recently modified
find /some/path -mtime -1 -lsblk
```
### `parted`
```bash
# list all drives and partitions
parted /dev print all
```
### `blkid`
```bash
# list all partitions with their UUIDs, filesystem types, and labels
blkid
```
### `lsblk` ⭐️
```bash
# show the partition tree with filesystem types, mountpoints, permissions, and sizes
lsblk -f -m
# show drives only with no partitions or headers
lsblk --nodeps --noheadings
```
### `lsscsi`
```bash
apt install lsscsi
# list all drives with info about size, disk id, etc.
$ lsscsi -s -P -p -g -i -D
[0:0:0:0] 0x0 ATA CT120BX300SSD1 010 /dev/sda - /dev/sg0 - none - 120GB
[2:0:0:0] 0x0 ATA CT2000BX500SSD1 030 /dev/sdg - /dev/sg6 - none - 2.00TB
[2:0:1:0] 0x0 ATA Samsung SSD 860 1B6Q /dev/sdh - /dev/sg7 - none - 500GB
[2:0:2:0] 0x0 ATA Samsung SSD 860 1B6Q /dev/sdi - /dev/sg8 - none - 500GB
[2:0:3:0] 0x0 ATA WDC WDS100T2B0A 00WD /dev/sdj - /dev/sg9 - none - 1.00TB
[2:0:4:0] 0x0 ATA WDC WDS100T2B0A 00WD /dev/sdk - /dev/sg10 - none - 1.00TB
[2:0:5:0] 0x0 ATA WDC WDS100T2B0A 00WD /dev/sdl - /dev/sg11 - none - 1.00TB
[3:0:0:0] 0x0 JMicron Generic DISK00 0103 /dev/sdb JMicron_Generic_DISK00_0123456789ABCDEF-0:0 /dev/sg1 - none - 8.00TB
[3:0:0:1] 0x0 JMicron Generic DISK01 0103 /dev/sdc JMicron_Generic_DISK01_0123456789ABCDEF-0:1 /dev/sg2 - none - 8.00TB
[3:0:0:2] 0x0 JMicron Generic DISK02 0103 /dev/sdd JMicron_Generic_DISK02_0123456789ABCDEF-0:2 /dev/sg3 - none - 8.00TB
[3:0:0:3] 0x0 JMicron Generic DISK03 0103 /dev/sde JMicron_Generic_DISK03_0123456789ABCDEF-0:3 /dev/sg4 - none - 8.00TB
[3:0:0:4] 0x0 JMicron Generic DISK04 0103 /dev/sdf JMicron_Generic_DISK04_0123456789ABCDEF-0:4 /dev/sg5 - none - 10.0TB
```
### `fdisk` ⭐️🌈
```bash
# list detailed information about disk device models, sector alignment and sizes, partition maps, partition types, block sizes
fdisk -l
```
### `zfs`/`nfs`/`samba`/`glusterfs`
Alternative filesystems / fileshares besides ext4.
### `dev-purge`
Find and clean build artifacts, dependency folders, and cache directories across all your projects. One command to reclaim gigabytes of disk space.
```bash
npm install -g dev-purge
dev-purge # Cycle through projects, y/n each
dev-purge ~/projects # Scan a specific directory
dev-purge --dry-run # Show bloat without deleting
dev-purge -a # Single confirmation to delete all
dev-purge -a --older-than 1y # Nuke everything older than a year
dev-purge -a --category cache --older-than 6m # Nuke old caches
dev-purge --category deps # Only node_modules, venv, Pods, etc.
dev-purge -s 100m # Only show bloat > 100 MB
dev-purge -s 0 # Show everything (no size minimum)
dev-purge --json # Machine-readable JSON output
dev-purge --watch # Real-time disk usage monitoring
```
- https://github.com/LarsenCundric/dev-purge
---
## Network
### `nethogs` ⭐️🌈
Show a list of processes sorted by network activity in realtime.
```bash
apt install nethogs
# show process traffic across all interfaces
nethogs
# show process traffic between all hosts on eno2 in promiscous mode
nethogs -p eno2
```
### `iftop`
Lists active network connections sorted by activity level in realtime.
```bash
# show all connections with ports
iftop -P
# show only connections on eno1 to/from 192.168.1.10
iftop -P -i eno1 -f "host 192.168.1.10"
# show traffic between all hosts on eno2 in promiscuous mode (if available)
iftop -P -i eno2 -p
# when inside of tmux/screen you may need to set TERM manually for pretty output
env TERM=xterm-256color iftop
```
- https://www.systutorials.com/docs/linux/man/8-iftop/
- https://www.thegeekstuff.com/2008/12/iftop-guide-display-network-interface-bandwidth-usage-on-linux/
- https://github.com/srix/iftopcolor
### `iptraf-ng`🌈
Show a real-time updating list of all connections by host `iftop`, with a log of the packets being sent. Can also show a statistical summaries of traffic per-host, per-interface, or per-packet-type.
```bash
iptraf-ng
```
- https://linux.die.net/man/8/iptraf-ng
- https://wiki.ipfire.org/addons/iptraf-ng
### `pktstat`
Display list of active connections including any HTTP requests within each connection.
```bash
# list active connections and requests on all interfaces sorted by traffic volume
pktstat -t
# list active connections and requests on eth0 with full hostnames and Byte totals
pktstat -i eth0 -t -B -F -T
```
### `speedometer` / `nload` / `bmon` / `slurm` / `bwm-ng` / `cbm` / `netload` / `ifstat` / etc. 🌈
Show realtime staticstics/graphs of total network traffic on the system.
These all work similarly and can be installed via most system package managers.
```bash
# Show a fancy colored realtime graph of sent and received traffic on eth0
speedometer -r eth0 -t eth0
```
- https://www.binarytides.com/linux-commands-monitor-network/
### `netstat` ⭐️
View information about processes bound to ports and active network connections.
```bash
# list processes listening on all ports (UDP & TCP, IPv4 & IPv6)
netstat -tulpn
# list all active connections with their current status
netstat -tupn
# list all active connections with their current status and realtime updating
netstat -tupnc
# show summary stats each type of socket
netstat -i
# show summary stats for type of protocol
netstat -s
# or show socket stats using ss
ss -s
```
- https://www.geeksforgeeks.org/netstat-command-linux/
- https://www.thegeekstuff.com/2010/03/netstat-command-examples/
### `ethtool`
Show information about the kernel module / driver powering a given network interface.
```bash
apt install ethtool
# show speed, duplex, and additional metadata for eth0 interface
ethtool eth0
# show feature flags status for eth0 interface
ethtool -k eth0
# show transfer stats for eth0 interface
ethtool -S eth0
# show the eth0 driver / kernel module
ethtool -i eth0
# identify the physical eth0 ethernet port by blinking its LED
ethtool -p eth0
```
- https://linux.die.net/man/8/ethtool
- https://www.thegeekstuff.com/2010/10/ethtool-command/
### `ip`/`ifconfig`
View network interface and routing table information.
```bash
# print entire routing table
ip route
# or on BSD systems
route -n
# get the default "next hop" route for the end destination 192.168.1.2
ip route get 192.168.1.2
# or on BSD systems
route get 192.168.1.2
# interface info with human-readable sizes for the eno1 interface
ip -s -h link show eno1
# or on BSD systems
ifconfig eno1
# show transfer stats for each interface
ip -s link
# or on BSD systems
ifconfig
```
- https://linuxize.com/post/linux-ip-command/
- https://www.cyberciti.biz/faq/linux-ip-command-examples-usage-syntax/
- https://www.tecmint.com/ip-command-examples/
- https://phoenixnap.com/kb/linux-ip-command-examples
### `ping`/`tcping`/`arping`
Basic ICMP/TCP/ARP ping utilities (you cant ping over UDP unless you have a process running on the server to send back a UDP response, like `iperf`).
```bash
apt install ping
# ping a given IP/host 10 times using ICMP with a 5sec timeout for each packet
ping -c 10 -t 5 <IP/host>
```
- https://linux.die.net/man/8/ping
- https://www.howtoforge.com/linux-ping-command/
```
apt install tcping
# send 10 TCP packgets to a given IP/host:80 with a 1sec delay between each
tcping -ip <IP/host> --port 80 --number 10 --sleep 1000
```
- https://github.com/AyoobAli/TCPing
- https://techtalk.gfi.com/troubleshooting-networks-with-tcping/
```bash
apt install arping
# ask peers on the network for the MAC address associated with 192.168.1.2
arping 192.168.1.2
# check for duplicate responses for the IP 192.168.1.5 (to detect ARP spoofing)
arping -d 192.168.1.4
```
- https://manpages.ubuntu.com/manpages/focal/man8/arping.8.html
- https://www.poftut.com/arping-command-tutorial-examples-linux/
- https://devconnected.com/arping-command-on-linux-explained/
### `arpwatch`
Monitor new ARP cache entries broadcased by devices on your local network.
```bash
apt install net-tools arpwatch
# show new ARP mappings announced on eth0 interface
arpwatch -i eth0
# show entire arp table
arp -a -v
# print only the arp entries for the host 192.168.1.2 on the interface eno1
arp -i eno1 -a 192.168.1.2
```
- https://linux.die.net/man/8/arpwatch
- https://www.tecmint.com/monitor-ethernet-activity-in-linux/
- https://www.geeksforgeeks.org/arp-command-in-linux-with-examples/
- https://www.computerhope.com/unix/arp.htm
### `iperf`/`iperf3` ⭐️
One-off command to test network speed over a single/multiple connections.
```bash
apt install iperf
# on the server
iperf -s
# on the client
iperf -c <ip/host of server>
```
```bash
apt install iperf3
# on the server
iperf3 -s
# on the client
iperf3 -c <ip/host of server>
```
(make sure to swap the client & server to test in both directions for the most accurate results)
- https://iperf.fr/iperf-doc.php
- https://fasterdata.es.net/performance-testing/network-troubleshooting-tools/iperf/
- https://support.cumulusnetworks.com/hc/en-us/articles/216509388-Throughput-Testing-and-Troubleshooting
- https://www.tecmint.com/test-network-throughput-in-linux/
### `nuttcp`
One-off command to test network speed with advanced options for TCP/UDP bursting, timing, packet sizes, and more. Better than `iperf` for stress testing network edge-conditions, buffer sizes of intermediate devices, or extremely high-bandwidth links.
```bash
apt install nuttcp
# on the server
nuttcp -S
# on the client
nuttcp -i1 <ip/host of server>
# send 300 Mbps of UDP traffic in bursts of 50 packets for 5 seconds
nuttcp -u -Ri300m/50 -i 1 -T5 <ip/host of server>
# saturate a 10Gbit connection with a 9K MTU using max-size UDP packets (len=8972)
nuttcp -l8972 -T30 -u -w4m -Ru -i1 <ip/host of server>
```
- https://fasterdata.es.net/performance-testing/network-troubleshooting-tools/nuttcp/
- https://www.systutorials.com/docs/linux/man/8-nuttcp/
- https://manpages.ubuntu.com/manpages/focal/man8/nuttcp.8.html
### `speedtest-cli`
A CLI to test your internet speed using the speedtest.net service.
```bash
pip install speedtest-cli
speedtest-cli
```
- https://github.com/sivel/speedtest-cli
- https://www.speedtest.net/apps/cli
### `dig`/`dug`/`dog`/`host`/`nslookup`/`doggo` 🌈
You can test DNS record resolution, trace, and speed stats using `dig` or `dog`.
```bash
apt install dnsutils
# simple example using system default resolver
dig -4 +trace example.com
# full example using 1.1.1.1 as the resolver with DNSSEC checking
dig -4 +dnssec +multi +trace @1.1.1.1 example.com
# get your public IP address using the opendns reflector resolver
dig -4 +short myip.opendns.com @resolver1.opendns.com
# get pretty colorized output optimized for human-readability
dog example.com A @1.1.1.1
host -t A example.com
nslookup example.com
curl -s ipinfo.io
```
- https://doggo.mrkaran.dev/docs/
- https://github.com/unfrl/dug
- https://github.com/ogham/dog
- https://github.com/TheRook/subbrute
### `mtr` ⭐️
Traceroute tool that shows realtime ping speed to all hops between you and a destination in realtime.
```bash
apt install mtr
# Simple trace of connection to example.com using ICMP
mtr example.com
# Full trace showing AS numbers, IP addresses, and ICMP extension info
mtr --show-ips --aslookup --mpls --max-ttl 20 example.com
# Trace using TCP port 80 instead
mtr --tcp --port 80 example.com
# Trace using UDP port
mtr --udp --port 80 example.com
```
- https://www.digitalocean.com/community/tutorials/how-to-use-traceroute-and-mtr-to-diagnose-network-issues
- https://www.cloudflare.com/learning/network-layer/what-is-mtr/
- https://vitux.com/how-to-use-the-linux-mtr-command/
### `nmap` ⭐️
Jack-of-all-trades port-scanner, network scanner, fingerprinter, and network tester.
```bash
apt install nmap
# scan all TCP ports on a given host
nmap -p 1-65535 -T4 -A -v <IP/hostname>
# detect host OS and protocols on open ports
nmap -sO <IP/hostname>
```
- https://nmap.org/
- https://nmap.org/book/man-examples.html
- https://www.tecmint.com/nmap-command-examples/
### `tcpdump` + `wireshark`
Collect a dump of all packets sent/received and inspect their contents.
```bash
# capture all packets on eth0 port 80, without resolving hostnames/ports
tcpdump -i eth0 -nn -s0 -v port 80
# show all HTTP GET/POST requests on all interfaces
tcpdump -s0 -v -n -l | grep -E -i "POST /|GET /|Host:"
# capture all packets on eth0 and write them to test.pcap
tcpdump -i eth0 -s0 -w test.pcap
# open a given pcap capture file in the wireshark GUI
wireshark -r test.pcap
```
- https://www.wireshark.org/docs/wsug_html_chunked/ChapterIntroduction.html
- https://hackertarget.com/tcpdump-examples/
- https://danielmiessler.com/study/tcpdump/
### `ssldump`
```bash
ssldump -k cert.key -i eth0 -dn host 123.123.123.123 and port 443
```
### `wsrepl` 🌈
Interactive REPL for websocket exploration.
- https://github.com/doyensec/wsrepl
### `iptables`/`iptables-tui`
Interactive TUI to explore iptables.
- https://github.com/davidmoreno/iptables-tui
### `impala` 🌈
TUI for managing Wifi on Linux
```bash
cargo install impala
impala
```
- https://github.com/pythops/impala
### `port-whisperer` 🌈
See a color-coded table of every dev server, database, and background process listening on your machine -- with framework detection, Docker container identification, and interactive process management.
```bash
npm install -g port-whisperer
ports --all
ports ps
ports watch
whoisonport 3000
ports kill 3000 # kill by port
ports kill 3000 5173 8080 # kill multiple
ports kill 42872 # kill by PID
ports kill -f 3000 # force kill (SIGKILL)
```
- https://github.com/LarsenCundric/port-whisperer
---
## Hardware
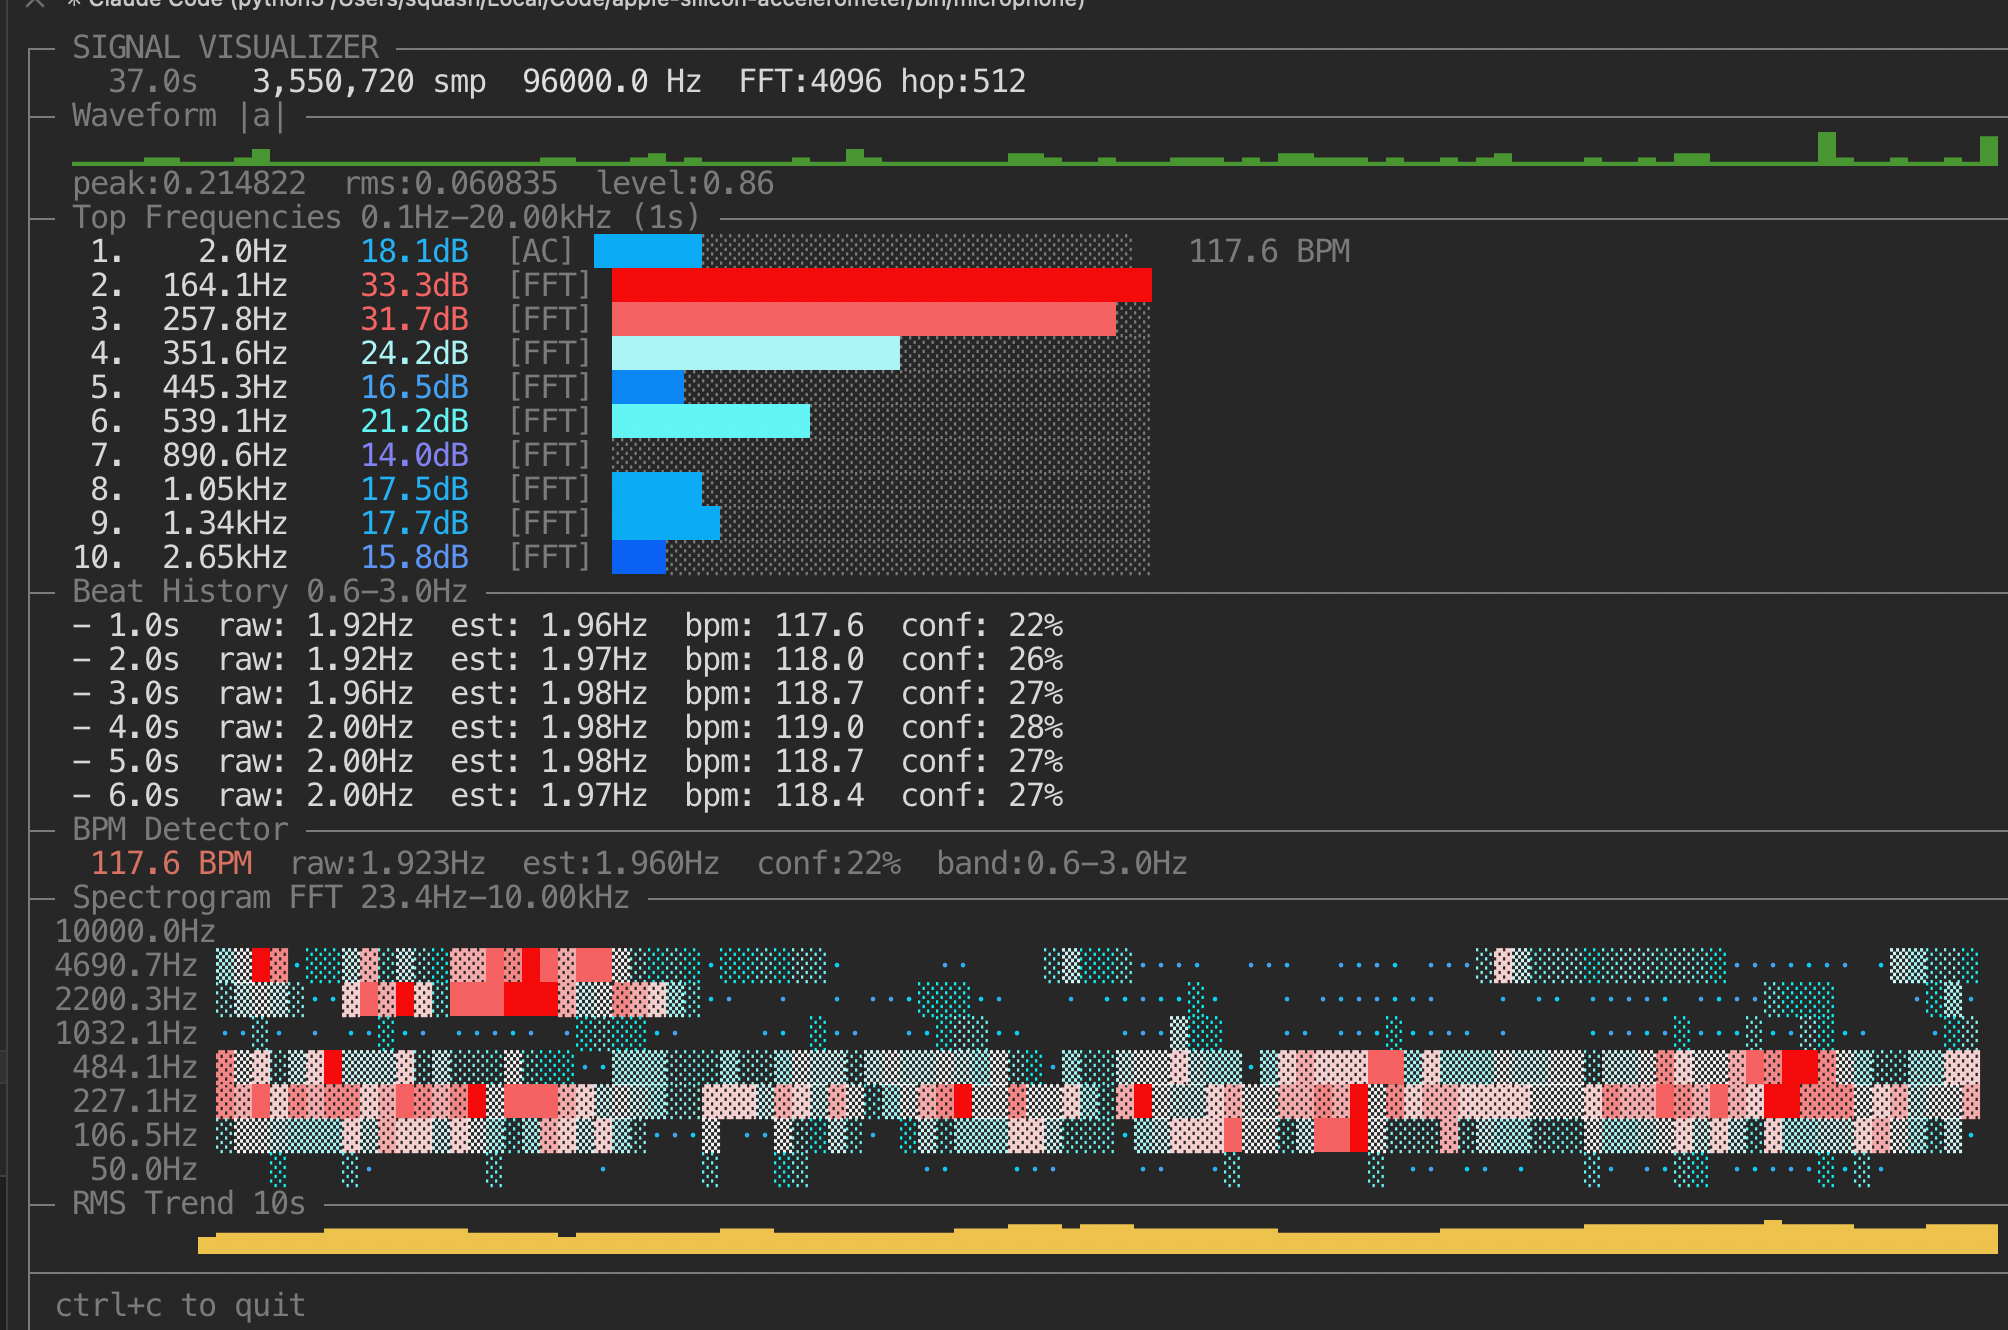
### `mac-hardware-toys` 🌈 ⭐️
A suite of commands like accelerometer, microphone, bandpass, keyboard-brightness, screen-brightness, and more that can be linked together using UNIX pipes.
All tools input and output a standardized mono audio signal that represents their sensor input/output values, letting you pipe together arbitrary sensor signals / output like a modular synth.
```bash
pip install mac-hardware-toys
# or
uv tool install mac-hardware-toys
# flash your screen according to your microphone input
microphone | screen-brightness
# play a sine wave tone based on your screen lid-angle
lid-angle | speaker
# flash the keyboard according to your heartbeat (keep your wrists on palm rests)
accelerometer | metronome | keyboard-brightness
# see more detail about any given signal by piping it into visualizer
microphone | visualizer
sine 1000 | visualizer
gyroscope | tee >(speaker) | visualizer
```
- https://github.com/pirate/mac-hardware-toys
- https://pypi.org/project/mac-hardware-toys
### `sensors`
Monitor hardware sensor values (e.g. temp, frequency, etc.).
```bash
apt install lm-sensors
sensors-detect
watch sensors
```
### `ipmitool`
Show additional sensor values not accessible to `lm-sensors`.
```bash
apt install ipmitool
# show all sensor values including voltage, current, temp, fan speeds, etc.
ipmitool sensor
# show ambient air temperature
ipmitool sdr type temperature | grep 'degrees C'
# get chassis hardware and power status information
ipmitool chassis status
```
### `i7z`
Show the the C-states and temperature for i3, i5 and i7 based Core processors from Intel.
```bash
apt install i7z
i7z
```
### `cpufreq-info` ⭐️
Show information about current CPU frequency, hardware limits, active governor policy, and more.
```bash
apt install cpufrequtils
# view CPU frequency info
cpufreq-info
# set upper CPU frequency limit to 1.6Ghz
cpufreq-set -u 1.6Ghz
# set the governor to userspace-controlled frequency with a constant 800Mhz frequency
cpufreq-set -g userspace
cpufreq-set -f 800Mhz
```
- http://www.thinkwiki.org/wiki/How_to_use_cpufrequtils
- https://wiki.debian.org/CpuFrequencyScaling
- https://wiki.archlinux.org/index.php/CPU_frequency_scaling
- https://www.kernel.org/doc/Documentation/cpu-freq/boost.txt
### `cpupower`
Get information about CPU clock speeds, governors, and power modes.
```bash
# show information on frequencies, turbo-boost, and transition speeds of installed CPUs
cpupower frequency-info
# show information about available idle states of installed CPUs
cpupower idle-info
# show per-core breakdown of usage, frequency, clock speed, and idle stats
cpupower monitor
```
### `powertop` ⭐️
Monitor CPU power consumption and power management on Linux.
```bash
apt install powertop
# show breakdown of power usage per-process in watts, cpu usage time, events/s and more
powertop
```
- https://github.com/fenrus75/powertop
- https://wiki.archlinux.org/index.php/Powertop
### `dmidecode`
```bash
# show SMBIOS data from sysfs about CPU sockets, vendors, architectures, available feature flags, versions, clock speeds, hyperthreading, turbo-boost, and more
dmidecode -t 4
# show system hardware summary
dmidecode --type system -q
# show processor hardware summary
dmidecode -q --type processor
# show memory hardware summary
dmidecode -q --type memory
dmidecode --type 17
free -m -h -t
```
### `smartctl` ⭐️
Monitor disk SMART sensor values and statuses (e.g. temp, power-on hours, write errors, etc.).
```bash
apt install smartmontools
# get all the SMART values and information for /dev/sdc
smartctl --all /dev/sdc
```
### `apcaccess status`
Monitor UPS power usage, battery level, voltage, and other stats.
```bash
apt install apcupsd
# enable in config
echo "UPSCABLE usb" >> /etc/apcupsd/apcupsd.conf
echo "UPSTYPE usb" >> /etc/apcupsd/apcupsd.conf
echo "DEVICE" >> /etc/apcupsd/apcupsd.conf
echo "ISCONFIGURED=yes" > /etc/default/apcupsd
systemctl enable apcupsd
systemctl start apcupsd
# show curent power draw, max power draw, battery level, voltage, runtime, etc.
apcaccess status
```
### `lshw` ⭐️
Show the entire hardware information tree with all info.
```bash
lshw
# less verbose output
lshw -short
# fetch SCISI, USB, PCI, etc. extended bus information
lshw -businfo
# output an HTML summary
lshw -html > hardware.html
```
- https://linux.die.net/man/1/lshw
- https://ezix.org/project/wiki/HardwareLiSter
- https://github.com/lyonel/lshw
- https://www.howtoforge.com/linux-lshw-command/
### `lsusb`
Show information about attached USB devices and connection topology.
```bash
# show all USB device info in tree format including vendor information
lsusb -v -t
```
### `usb-devices` ⭐️
List attached USB device BUS IDs + type, device IDs, vendor IDs, serial numbers, driver, feature flags, and power consumption info.
```bash
usb-devices
```
### `camcontrol`
Show information about available hardware on FreeBSD systems using the CAM system.
```bash
camcontrol devlist
```
- https://www.freebsd.org/cgi/man.cgi?query=camcontrol&sektion=8
### `dmesg` ⭐️
View kernel log output related to hardware devices, including connection/disconnection events, errors, warnings, debug info, and more.
```bash
dmesg
```
- https://man7.org/linux/man-pages/man1/dmesg.1.html
- https://www.tecmint.com/dmesg-commands/
- https://www.linuxtechi.com/10-tips-dmesg-command-linux-geeks/
### `last`
Show information and logs from the most recent boot.
```bash
# show last boot log w/ init level changes, full usernames, and timestamps
last -x -w -F | tac
```
---
## VM / Docker
### `ctop` ⭐️🌈
`htop` equivalent for monitoring containers, works for Docker and runC and has pretty colors.
```bash
brew install ctop
# show performance stats, entrypoint, and health of all active containers
ctop -a
```
(see [`glances`](#glances-⭐%EF%B8%8F) for `htop` + `ctop` all-in-one)
- https://github.com/bcicen/ctop
- https://www.tecmint.com/ctop-monitor-docker-containers/
### `docker stats`
The docker equivalent of `top`. Uncolored output, one row per container.
```bash
docker stats
docker compose stats
```
- https://docs.docker.com/engine/reference/commandline/stats/
### `virt-top`
Monitor performance statistics of virtual machines on a KVM host.
```bash
apt install virt-top
virt-top
```
- https://linux.die.net/man/1/virt-top
- https://github.com/olafhering/virt-top
- https://packages.debian.org/stretch/virt-top
### `esxtop`
Monitor performance statistics of virtual machines on an ESXi host.
```bash
ssh someuser@esxi-host esxtop
```
- https://kb.vmware.com/s/article/1008205
- http://www.yellow-bricks.com/esxtop/
- https://www.virten.net/vmware/esxtop/
---
## DB / Webserver
### `pg_top` ⭐️
Show PostgreSQL performance information.
```bash
apt install pgtop
# connect to postgres@localhost:5432/example and show perf stats w/ color
pg_top --color-mode -h localhost -p 5432 -d example -U postgres
```
- https://gitlab.com/pg_top/pg_top
- https://manpages.ubuntu.com/manpages/focal/man1/pg_top.1.html
- https://metacpan.org/pod/release/COSIMO/pgtop-0.05/pgtop
- https://severalnines.com/database-blog/dynamic-monitoring-postgresql-instances-using-pgtop
### `mytop`
Show MySQL performance information.
```bash
apt install mytop myps
# connect to mysql@localhost:3306/example and show perf stats w/ color
mytop -color -h localhost -P 3306 -u mysql -d example
```
- http://jeremy.zawodny.com/mysql/mytop
- https://manpages.ubuntu.com/manpages/focal/en/man1/mytop.1p.html
- https://www.tecmint.com/mytop-mysql-mariadb-database-performance-monitoring-in-linux/
- https://github.com/kazeburo/myps
### `redis-stat`
Show Redis performance information.
```bash
gem install redis-stat # also available as a JAR file
# show performance stats of a redis db on localhost:6380 every 1sec
redis-stat --verbose localhost:6380 1
# you can also use redis's built-in monitoring commands
redis-cli INFO
redis-cli MONITOR
```
- https://github.com/junegunn/redis-stat
- https://www.datadoghq.com/blog/how-to-monitor-redis-performance-metrics/
- https://redis.io/commands/monitor
- https://blog.serverdensity.com/monitor-redis/
### `ngxtop` ⭐️
Show Nginx performance information.
```bash
pip install ngxtop
# show summary of performance and breakdown by request URL
ngxtop
# show summary of usage by client IP
ngxtop top remote_addr
# show 4xx/5xx responses by referrer
ngxtop -i 'status >= 400' print request status http_referer
```
- https://github.com/lebinh/ngxtop
- https://github.com/gsquire/topngx
### `apachetop`
Show Apache performance information.
```bash
apt install apachetop
# show performance statistics parsed from the example.com access_log
apachetop -f /var/www/vhosts/example.com/statistics/logs/access_log
```
- https://linux.die.net/man/1/apachetop
- https://www.howtogeek.com/howto/ubuntu/monitor-your-website-in-real-time-with-apachetop/
- https://www.liquidweb.com/kb/how-to-install-and-use-apachetop/
- https://github.com/fr3nd/apache-top
- https://www.tecmint.com/monitor-apache-web-server-load-and-page-statistics/
- https://httpd.apache.org/docs/2.4/mod/mod_status.html
### `uwsgitop`
Show uWSGI performance information.
```bash
pip install uwsgitop
# enable the stats socket on the server
uwsgi --module myapp --socket :3030 --stats /tmp/stats.socket
# then connect to it with uwsgitop
uwsgitop /tmp/stats.socket
```
- https://github.com/xrmx/uwsgitop
- https://www.engagespark.com/blog/deploying-monitoring-python-web-apps-uwsgi/
## Packaging / OS / System
### `abx-pkg` + `abx` 🌈 ⭐️
Like `uv` / `uvx` but for ALL package managers: `apt`, `brew`, `pip`, `uv`, `npm`, `pnpm`, `yarn`, `bun`, `deno`, `cargo`, `gem`, `goget`, `nix`, `docker`, `bash`, `chromewebstore`, `puppeteer`, `playwright`, `ansible`, `pyinfra`
```bash
pip install abx-pkg
abx-pkg install wget
abx-pkg run wget --version
abx-pkg install --binproviders=playwright,puppeteer,apt,brew chromium
abx-pkg update chromium
abx-pkg uninstall chromium
abx yt-dlp --version # auto-dowload and run yt-dlp "by any means possible", tries all providers until one finds it
```
```python
from abx_pkg import Binary, apt, brew, pip, npm, env
# Provider singletons are available as simple imports — no manual instantiation needed
dependencies = [
Binary(name='curl', binproviders=[env, apt, brew]),
Binary(name='yt-dlp', binproviders=[env, pip, uv, apt, brew]),
Binary(name='playwright', binproviders=[env, npm, pnpm]),
Binary(name='chromium', binproviders=[playwright, puppeteer, apt]),
Binary(name='postgres', binproviders=[docker, env, apt, brew]),
]
for binary in dependencies:
binary = binary.load_or_install()
print(binary.abspath, binary.version, binary.binprovider, binary.is_valid, binary.sha256)
# Path(...) SemVer(...) EnvProvider()/AptProvider()/BrewProvider()/PipProvider()/NpmProvider() True '<sha256>'
binary.exec(cmd=['--version']) # curl 7.81.0 (x86_64-apple-darwin23.0) libcurl/7.81.0 ...
```
Also supports defining dependencies at the top of scripts in a shebang (similar to `uv` `script` mode), but for *any* language not just python.
Uses safe defaults to prevent supply-chain attacks: `--min-release-age=7` + `--postinstall-scripts=False`, hermetically installs packages in an isolated prefix to avoid breaking system packages, but can also be used for global system packages.
- https://github.com/ArchiveBox/abx-pkg
- https://archivebox.github.io/abx-pkg
- https://deepwiki.com/ArchiveBox/abx-pkg
- https://pypi.org/project/abx-pkg
### `nala` 🌈
Prettier drop-in replacement frontend for the `apt` package manager. Provides faster parallelized downloads, better progress bars, extra helpers, etc. on top of `apt`.
```bash
apt install nala
# then use it in place of apt:
nala update
nala install python3 nodejs
```
- https://github.com/volitank/nala
### `uname`
Get active kernel and architecture information.
```bash
uname --all
# or to only get architecture
arch
```
### `lsmod`
Get active kernel module list.
```bash
lsmod
```
### `lsb_release`
Get Ubuntu version info.
```bash
lsb_release --all
```
### `watchdog`/`auditd`/`acct`
System event monitoring, audit logging, alerting tools, etc.
```bash
apt install watchdog auditd acct
# read documentation for more info
man watchdog
man auditd
man acct
```
### `systemd-analyze` / `isd`
Useful for track down the cause of slow boots and other startup service issues.
```bash
# list all processes that started at boot, ordered from slowest to fastest
systemd-analyze blame
# plot the services that ran at boot as a pretty SVG with colors
systemd-analyze plot > boot-trace.svg
# see what security permissions the docker service has enabled
systemd-analyze security docker
# use a nice TUI to browse and manage systemd units
isd
```
- https://isd-project.github.io/isd/
### `dpkg`/`apt list`/`apt-file`/`apt-mark`
Other useful apt-related package management commands.
```bash
apt list --installed
apt-mark showmanual
apt show <packagename>
dpkg -L <packagename>
apt-file search <filename>
```
## Profiling / Debugging
### `pv`/`progress` ⭐️
Show progress of `cp`, `mv`, etc. file transfer operations, pipe operations, etc.
```bash
apt install pv progress
cat some_large_file.txt | pv | gzip -9 > compressed_file.txt.gz
cp compressed_file.txt.gz /some/other/location
progress
```
- https://github.com/Xfennec/progress
### `strace`/`dtrace`/`dtruss` ⭐️
Trace the system calls of a given process to watch what it's doing internally.
```bash
# Run `ls /home` and print all system calls to stdout
strace ls /home
# Print 'open' or 'read' system calls with timestamps
strace -t -e open,read ls /home
# Attach to a running process by PID
strace -p 1234
```
(`dtrace` is the macOS/BSD equivalent to `strace`)
- https://www.tecmint.com/strace-commands-for-troubleshooting-and-debugging-linux/
- https://www.thegeekstuff.com/2011/11/strace-examples/
- https://www.deepanseeralan.com/tech/fun-with-dtruss-macOS/
- https://poweruser.blog/using-dtrace-with-sip-enabled-3826a352e64b
### `ltrace`
Trace the dynamic calls made to shared libraries to see how processes are using shared libs.
```bash
# attach to a specific PID and show call names with start timestamp and duration
ltrace -t -T -p 1234
# Run `docker ps` and only show calls made to the libselinux.so dylib (with timestamps)
ltrace -t -T -l /lib/libselinux.so.1 docker ps
```
- use [`LD_PRELOAD`](https://www.tomaz.me/2014/01/08/detecting-which-process-is-creating-a-file-using-ld-preload-trick.html?utm_source=pocket_saves)/[`DYLD_INSERT_LIBRARIES`](https://gist.github.com/talaviram/1f21e141a137744c89e81b58f73e23c3?permalink_comment_id=3975633&utm_source=pocket_saves) directly for more preload-injection tracing fun
- https://gitlab.com/cespedes/ltrace
- https://manpages.ubuntu.com/manpages/cosmic/man1/ltrace.1.html
### `witr`
"Why is this thing running?" Check why a given process, port, pid, etc. is running, what started it, what's keeping it alive, etc.
```bash
# install
# curl -fsSL https://raw.githubusercontent.com/pranshuparmar/witr/main/install.sh | bash
# check why a port is listening
witr --port 5000
# check by process name
witr node
# check by pid and show full tree output
witr 234 --tree
```
- https://github.com/pranshuparmar/witr
### `binwalk`/`strings`/`hexyl`/`hexabyte`/`dissy` 🌈
Decompiler utility normally used to inspect firmware binaries, but is useful along with `strings` to see what a binary contains before you run it.
```python3
pip3 install 'git+https://github.com/ReFirmLabs/binwalk.git'
# extract the full root filesystem from a firmware image binary
binwalk --extract some_firmware.bin
# show machine instructions used in a given firmware
binwalk --opcodes some_executable.bin
# show all strings found inside a binary blob
strings some_binary_blob.exe
# show hex dump explorer with pretty color highlighting
hexyl /bin/some_binary.exe
```
- https://github.com/ReFirmLabs/binwalk/blob/master/INSTALL.md
- https://github.com/ReFirmLabs/binwalk/wiki/quick-start-guide
- https://github.com/sharkdp/hexyl 🌈
- https://github.com/thetacom/hexabyte ⭐️🌈
- https://github.com/tonybaloney/dissy ⭐️🌈
### `profano`
CLI tool to analyze V8 .cpuprofile files and print the top functions by self-time or total-time directly in the terminal. Built for AI agents and humans who want quick profiling insights without opening Chrome DevTools.
```bash
npm install -g profano
# Analyze a profile, sorted by self-time (default)
profano ./tmp/cpu-profiles/CPU.*.cpuprofile
# Sort by total/inclusive time instead
profano profile.cpuprofile --sort total
# Show the top 50 functions (default 30)
profano profile.cpuprofile -n 50
```
- https://github.com/remorses/profano
---
## Shell Utilities
### `bat`/`pygmentize`/`grc`/`colortail`/`rich`/`imgcat`/`timg` ⭐️🌈
Tools to help you generically colorize the output any command. Great for printing logfiles, source code, config files, tracebacks, etc. any other structured data with syntax highlighting.
```bash
bat < docker.log
docker compose logs | grc
pygmentize -g < somecode.py
...
```
- https://github.com/sharkdp/bat ⭐️
- https://github.com/garabik/grc ⭐️
- https://github.com/pygments/pygments ⭐️
- https://github.com/sharkdp/hexyl ⭐️
- https://github.com/textualize/rich-cli ⭐️
- https://github.com/eddieantonio/imgcat ⭐️
- https://github.com/owenthereal/ccat
- https://github.com/joakim666/colortail
- https://github.com/tanderson92/supercat
- https://codeberg.org/mehrad/highlighter
- https://www.gnu.org/software/src-highlite/
- https://github.com/armandino/TxtStyle
- https://github.com/PatrickF1/colored_man_pages.fish / https://github.com/decors/fish-colored-man
- https://github.com/Kikobeats/awesome-cli#output
- https://github.com/victante/trish
-
- [and more here...](https://stackoverflow.com/questions/7851134/syntax-highlighting-colorizing-cat)
### `iTerm2`/`fig` ⭐️ 🌈
Alternative Terminal Emulator applicaitons with tons of extra features.
- https://iterm2.com/
- https://github.com/withfig/fig
### `fish`/`fisher`/`fifc` ⭐️ 🌈
```bash
apt install fish
fish
curl -fsSL 'https://raw.githubusercontent.com/jorgebucaran/fisher/main/functions/fisher.fish' | source
fisher install jorgebucaran/fisher
fisher install gazorby/fifc
```
Alternative to traditional `bash` shell with better autocomplete, image viewing support, user-installable plugins, and other features.
- ⭐️ https://github.com/pirate/fish-utils (fish functions I wrote myself + many useful links)
- https://github.com/jorgebucaran/fisher (fish plugin manager)
- https://github.com/topics/fish-plugin (list of fish plugins on github)
- ⭐️🌈 https://github.com/gazorby/fifc (awesome fzf style autocomplete for cli args, git, etc.)
### `tmux`/`tmux2html`
```bash
apt install tmux
# stream your tmux window as a live-updating HTML UI on http://0.0.0.0:8000
pip install tmux2html
tmux2html -o index.html --stream --interval 1 0
python3 -m http.server --directory . --bind 0.0.0.0 --port 8000
```
### `atuin` ⭐️🌈
Improved shell history manager that can also sync history between machines (encrypted).
```bash
bash <(curl https://raw.githubusercontent.com/atuinsh/atuin/main/install.sh)
atuin status
atuin help
```
- https://github.com/atuinsh/atuin
### `shellcheck` ⭐️
```bash
apt install shellcheck
shellcheck /some/bash/script.sh
```
Best linter available for bash scripts with hundreds of checks for common mistakes.
- https://github.com/koalaman/shellcheck
### `ag`/`ripgrep`/`ack`/`ugrep` ⭐️
`grep -r`/`git grep` replacement with much faster performance and additional features.
```bash
apt install silversearcher-ag
ag 'some-regex' .
```
- https://github.com/Genivia/ugrep 🌈
### `autojump`/`z`/`zoxide`/`aj`/`pj`/`fasd`/`j` ⭐️
Cd into recently used directories quickly (fuzzy-matched).
- https://github.com/jethrokuan/z ⭐️
- https://github.com/joelthelion/autojump ⭐️
- https://github.com/kidonng/zoxide.fish
- https://github.com/oh-my-fish/plugin-pj
### `eza`/`exa`/`lsd`/`lsp`/`broot`/`fzf`/`browsr` 🌈
`cd` and `ls` replacements.
```bash
brew install eza
eza --header --group-directories-first -s name \
--time-style=long-iso --created --modified \
--all --long --extended --group --git --classify --icons \
--ignore-glob=.DS_Store \
/some/directory/path
```
- https://github.com/eza-community/eza ⭐️
- https://github.com/juftin/browsr ⭐️
- https://github.com/junegunn/fzf ⭐️
- https://github.com/Donaldttt/fuzzyy
- https://github.com/Canop/broot
- https://github.com/lsd-rs/lsd
- https://github.com/dborzov/lsp
### `micro`/`most`/`toolong`/`logmerger` 🌈
`nano`, `cat`, and `less` alternatives with multi-cursor selection, syntax highlighting, mouse support, and more.
```bash
pipx install toolong
apt install bat most
brew install micro
tl /path/to/some/file.js
tl access.log* --merge
most /path/to/some/file.js
bat /path/to/some/file.js
micro /path/to/some/file.js
```
- https://github.com/textualize/toolong
- https://github.com/ptmcg/logmerger
### `jq`/`yq`/`jsome`/`mlr`/`confget`/`plutil`/`pup`/`peco`/`glow`/`hexyl`
Command-line parsers and manipulators of JSON, YAML, XML, CSV, INI, and PLIST formats.
- https://github.com/Javascipt/Jsome
- https://github.com/peco/peco
- https://github.com/ericchiang/pup
- https://github.com/charmbracelet/glow
- https://github.com/thetacom/hexabyte
### `watch`/`timeout`/`wait`/`mkfifo`/`nohup`/`disown`/`bg`/`fg`/`jobs`
Watch the output of any command for changes and highlight the diff, useful in conjuction with other tools below.
```bash
# show changes in the output of `ip -s link show eno1` highlighting network IO
watch -n1 -d ip -s link show eno1
# show changes in the output of `lsof +D /mnt/somedrive` highlighting accesses
watch -n1 -d lsof +D /media/usb
# run a long-running command with a given timeout
timeout 10 wget 'https://example.com/some/large/file'
# wait for a pid to finish running and exit with its return status
wait 123
# create a fifo pipe for inter-process communication
mkfio /tmp/testpipe
mknod /tmp/testpipe p
```
- https://www.lostpenguin.net/index.php/bg-fg-jobs-nohup-and-disown/
- https://www.networkworld.com/article/970196/sleeping-and-waiting-on-linux.html
- https://github.com/pirate/bash-utils
### `op`/`passman`/`keyring`/`uuidgen`/`openssl`/`mkcert`/`certbot`
Password, secret, and token generators/managers.
```bash
openssl rand -hex 20
# 8ca5a28c055a766aa5a676fff24a9755fdd113f4
```
<br/>
---
---
<br/>
## Further Reading
- https://terminaltrove.com/
- https://github.com/ibraheemdev/modern-unix
- https://github.com/rothgar/awesome-tuis
- https://github.com/alebcay/awesome-shell
- https://github.com/cdleon/awesome-terminals
- https://github.com/xuxiaodong/awesome-shell
- https://github.com/awesome-lists/awesome-bash
- https://github.com/joseluisq/awesome-bash-commands
- https://github.com/toolleeo/cli-apps
- https://github.com/agarrharr/awesome-cli-apps
- https://github.com/Kikobeats/awesome-cli
- https://www.linuxlinks.com/alternatives-popular-cli-tools/
- https://dev.to/lissy93/cli-tools-you-cant-live-without-57f6
- https://awesome-docker.netlify.app/
- https://docs.sweeting.me/s/an-intro-to-the-opt-directory
- https://12factor.net/
<center>