<center>
# Python Performance Profiling & Optimization
Originally published 2019-12-05 on <a href="https://docs.sweeting.me/s/blog#About">docs.sweeting.me</a>, republished on <a href="https://monadical.com/blog.html">Monadical.com</a>.
<hr/>
<b style="opacity: 0.8">Modern techniques for Python performance profiling & optimization.</b>
<small>Tested with Python >3.7 and Django >2.2 as of 2019, but approaches are widely applicable.</small>
<img src="https://docs.monadical.com/uploads/upload_7f6377d1e68f48ac9942ee9fd664e798.png" style="width: 100%">
<br/>
---
</center>
[TOC]
---
### General Process
When a slow piece of code is identified in a codebase and singled out for improvement, the same general approaches can be used to improve performance, regarless of the type of project.
Tests are first written, then run using a "profiler": a tool that collects timing statics during runtime to measure how long the process spend executing each area of code, the code is improved, and the tests maintained to protect against future regressions.
1. First, tests are written to solidify the boundaries around the slow piece of code that needs to be optimized, and ensure correctness.
2. Then a suite of performance tests are written to verify baseline performance of the entire slow area.
3. Then the tests are run using a profiler to find the slowest functions and IO.
4. The code is then optimized in multiple passes, starting with the slowest things first.
- Blocking IO is reduced or batched as much as possible
- computational complexity of the algorithm is reduced, or caching/heuristic-based shortcuts added when complexity cannot be reduced
- only after everything else is stripped down should low-level performance or runtime optimization be considered. Only at this stage should we worry about things like cache alignment, function call overhead, recursion overhead, etc.
- As a last resort, and alterntive runtime or language can be considered for the slow code, e.g. a JIT like PyPy, or via bindings to a faster C++ or Rust subroutine.
5. The improved performance is then enforced with ongoing performance tests to ensure regressions to occur.
---
### The first step to performance is correctness.
Writing tests is critical to the performance optimization process.
1. it ensures the code stays correct as we make potentially breaking changes. attempts to improve performance often lead to unforseen bugs.
2. it provides a quick feedback cycle when making changes, we can tweak somthing and re-run a performance test multiple times a minute, vs manual testing where it's cumbersome and difficult to precicely reproduce.
3. It makes it easy to verify the real-world improvement of optimizations applied, and prevent regressions. it's easy to *feel* like something is 30% faster, but without hard numbers and reproducible performance tests, it might a fluke or quirk of the environement
> Write black-box tests around the slow code to ensure correctness at the boundary.
Don't optimize code until you're sure it's correct. Python.org says it best:
<center>
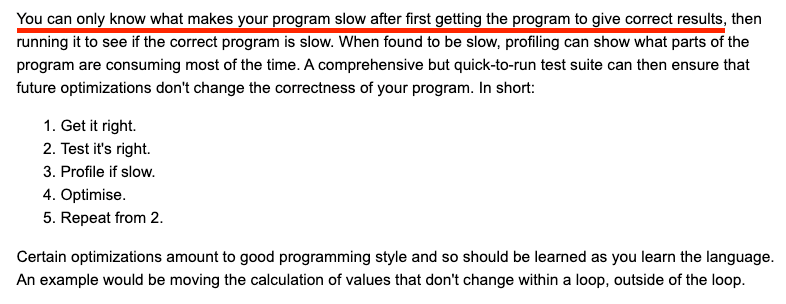
<small>From https://wiki.python.org/moin/PythonSpeed/PerformanceTips</small>
</center>
---
### Using a profiler
Profile with 3 levels of tests to evaluate each potential code change:
1. the easiest, most straightforward case (to ensure best-case performance & correctness)
2. the gnarliest, most error-prone path (to ensure worst-case performance & correctness)
3. a hot, CPU/IO-intensive path tested in a loop (to quantitatively measure slowness)
#### Check out these python profilers to get started
- [`cprofile`](https://docs.python.org/3/library/profile.html)
- [`silk`](https://github.com/jazzband/django-silk)
- [`pyflame`](https://eng.uber.com/pyflame/)
- [`pptop`](https://github.com/alttch/pptop)
- [`profiling`](https://github.com/what-studio/profiling)
#### Things to look for in profilers
- is it sampling or tracing? (sampling has less overhead but also less granularity)
- does it support multithreaded, multiprocess, or asyncronous code?
- does it record timing per line, per expression, per function?
- what sampling resolution / tracing depth is supported?
- whats the overhead cost of running with profiling enabled?
- does it require a different python binary or alter the runtime environment?
- can it produce & consume `cprofile` output or does it use custom formats?
---
### What to optimize first
Always optimize big -> small. Don't prematurely optimize code that isn't the slowest area. Focus on the things that will provide the big gains first, and worry about microptimization of python when there are no other factors to rule out.
#### The Big Stuff: Blocking IO
Blocking IO is by far the most common source of slowness. Whether it's a database query, a file read, or a network call. IO latency is almost always >80% of a request lifecycle's wall-clock time, and should the first thing to optimize.
Batch your IO as much as possible, do a small number of database queries at the beginning of a function to get everything needed up-front, then operate on the objects in-memory, with all the writes batched together at the end of the process.
Be wary of causing inadverdent blocking IO by making things to big to fit in memory. When things no longer fit, the computer starts to swap pages to disk and you end up with blocking disk IO all over the place.
#### Second-pass: Reduce algorithmic complexity
The next big culprit of slow python code is accidental algorithmic complexity explosions. Eg. when you have a 10,000 items to compare with 10,000 other items, you can easily fall into the trap of doing it O(n2).
```python
# task: find the items that are present in both lists
list_a, list_b = [... 10,000 items ...], [... 10,000 items ...]
# BAD: O(n^2)
matches = [item for item in list_a if item in list_b]
# 10,000 items * 10,000 comparisons = 100 million operations total!
# GOOD: O(n)
set_b = set(list_b)
matches = [item for item in list_a if item in set_b]
# 10k ops to initialize the set + 10k * O(1) set lookups = only 20k ops total
```
#### Low-level Optimization Last
"instead of calling a function 1000x in a loop, call a one function that does 1000 things"
From https://wiki.python.org/moin/PythonSpeed/PerformanceTips#Data_Aggregation
```python3
import time
x = 0
def doit1(i):
global x
x = x + i
list = range(100000)
t = time.time()
for i in list:
doit1(i)
print "%.3f" % (time.time()-t)
```
vs
```python3
import time
x = 0
def doit2(list):
global x
for i in list:
x = x + i
list = range(100000)
t = time.time()
doit2(list)
print "%.3f" % (time.time()-t)
```
---
### Alternative Python Implementations
- CPython
- Cython / Pyrec
- PyPy
- IronPython
- MicroPython (microcontrollers)
- Psyco (Deprecated)
---
### Resources
#### General
- https://wiki.python.org/moin/PythonSpeed/PerformanceTips
- https://github.com/plasma-umass/scalene
- https://towardsdatascience.com/speeding-up-python-code-fast-filtering-and-slow-loops-8e11a09a9c2f
- https://hackernoon.com/which-is-the-fastest-version-of-python-2ae7c61a6b2b
- https://www.quora.com/Which-is-the-fastest-implementation-of-Python
- https://eng.uber.com/pyflame/
- https://github.com/evanhempel/python-flamegraph
- https://github.com/Datamine/Function-Profiler
- https://github.com/what-studio/profiling
- https://github.com/alttch/pptop
- https://github.com/jrfonseca/gprof2dot
- https://github.com/csurfer/pyheat
- https://github.com/leopd/timebudget
- https://github.com/asottile/importtime-waterfall
#### Django
- https://github.com/jazzband/django-silk
- https://github.com/23andMe/djdt-flamegraph
- https://github.com/inglesp/django-debug-toolbar-template-flamegraph
#### Pandas
- https://realpython.com/fast-flexible-pandas/
- https://www.kdnuggets.com/2019/11/speed-up-pandas-4x.html
- https://realpython.com/fast-flexible-pandas/
#### Outdated
- https://intermediate-and-advanced-software-
carpentry.readthedocs.io/en/latest/increasing-performance.html#speeding-up-python
- https://en.wikipedia.org/wiki/Psyco (Deprecated)
- https://wiki.python.org/moin/Pyrex
---
<center>
<a href="#">
<img src="https://docs.monadical.com/uploads/upload_b097a513867451637b2b474f8d7196b1.png" style="height: 60px;">
</a><br/>
<small>
<br/><a href="https://monadical.com">Monadical</a> is a fully-remote, full-stack software consultancy with years of experience<br/>profiling & improving the performance of complex Python & JS applications.<br/> <a href="https://monadical.com/about.html#contact">Hire us</a> to work on your project!<br/>
</small>
</i>
</center>