<center>
# Building a FastAPI Server to Evaluate Mathematical Functions
<big>
**We make an already-powerful program for plotting mathematical functions even better using three steps.**
</big>
*Written by [Juan David Arias](https://github.com/juanArias8). Published 2022-08-04 on the [Monadical blog](https://monadical.com/blog.html).*
</center>
In my [last post](https://monadical.com/posts/plot-mathematical-functions-in-python.html), I shared a Python script that I wrote to plot function graphs using the SymPy, NumPy and Matplotlib libraries. Since then, I’ve revisited the project and dealt with some of the limitations of the script that I noticed. It might be worth reading that post first to understand the context of this article if you haven’t already.
Two of the big past limitations of the script were **portability & accessibility.** The previous script could only be used by devices that had Python, SymPy, NumPy and Matplotlib installed. This meant that users who lacked knowledge of these tools or the languages used in the script wouldn’t have been able to use it.
In this blog, we’ll create a more accessible version of the script, and therefore expand the number of potential users.
## The plan: building the application server
We'll create a server that is easier to use for people who have limited or no knowledge of programs like Python or SymPy. The main features of this application server will be to:
* receive the information associated with a mathematical function $f(x)=(...)$
* evaluate the function in the interval defined by $[a, b]$
* create the grid of values associated in the corresponding dimensions
* return all of this information to the client.
With this new server, users will only need to make use of the server’s endpoints. In addition, this solution will make the graph more interactive for client applications like web or mobile.
To achieve this, we’ll need to complete the following steps:
* Step one: Create an application server using *FastAPI*
* Step two: Model our business logic
* Step three: Add the services
## Tools we’ll need
To start creating a *FastAPI* server, we’ll need a version of Python 3.6+ installed on our computer. If we want to verify from a terminal, we can enter the command:
```shell
Python --version
```
These are the libraries and the concept we’ll need to use in order to build the application server.
**[FastAPI](https://fastapi.tiangolo.com):** is a modern, fast (high-performance), web framework for building APIs with Python 3.6+ based on standard Python type hints.
**[pydantic](https://pydantic-docs.helpmanual.io):** is a library for data validation and settings management using Python type annotations. Pydantic enforces type hints at runtime, and displays user-friendly error messages when data is invalid.
**[typing](https://docs.python.org/3/library/typing.html):** is a Python library that enables support for type hints.
**[SymPy](https://www.sympy.org/en/index.html):** is a Python library for symbolic mathematics. It’s a computer algebra system (CAS) that aims to keep the code as simple as possible so that it’s comprehensible and easily extensible.
**[NumPy](https://numpy.org/doc/stable/user/whatisnumpy.html):** is the fundamental package for scientific computing in Python. It’s a Python library that provides a multidimensional array object; various derived objects (such as masked arrays and matrices); and an assortment of routines for fast operations on arrays, including mathematical, logical, shape manipulation, sorting, selecting, I/O, discrete Fourier transforms, basic linear algebra, basic statistical operations, random simulation and much more.
## Step one: Create an application server using *FastAPI*
First we create a folder called `grafar-server` and go inside the directory.
```shell
mkdir grafar-server && cd grafar-server
```
Once inside the directory, let’s create a virtual environment to store the dependencies of the project. Then, run the following commands from the terminal:
```shell
pip install virtualenv
virtualenv venv
source venv/activate
```
Add the following dependencies inside the `requirements.txt` file.
```
uvicorn==0.13.3
fastapi==0.63.0
pydantic==1.7.3
numpy~=1.20.2
sympy~=1.7.1
```
Finally, install the dependencies with the help of pip.
``` shell
pip install -r requirements.txt
```
We should now have the initial configuration of the project, and can begin to program the server. To start the program, we’ll create the `main.py` file (the entry point for our endpoints). In the file, we create the first method to verify that the server is functioning as intended.
```python
import uvicorn
from fastapi import FastAPI
app = FastAPI()
@app.get("/health")
async def get_server_health():
return {"success": True, "message": "grafar server running"}
if __name__ == "__main__":
uvicorn.run("main:app", host="127.0.0.1", port=5000, reload=True)
```
Then, run the server with the following command:
```shell
python main.py
```
We should now have a FastAPI server running. To check that it’s running, go to http://127.0.0.1:5000/health on an Internet browser. If everything is working, we’ll see the following on the screen:
```json
{
"success": true,
"message": "grafar server running"
}
```
## Step two: Model our business logic
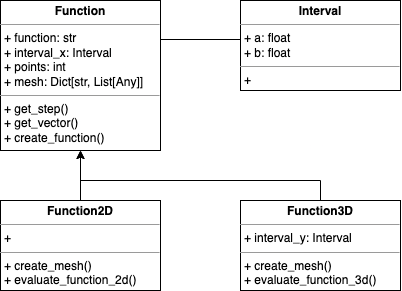
In the `pydantic` library, a model is an object that abstracts the attributes and behaviors of an [entity](https://www.quora.com/What-is-entity-in-a-programming-language) from the business logic. The models in our server will be represented by Python classes, and will be [inherited](https://python-course.eu/oop/inheritance.php) from pydantic’s `BaseModel` class. In total, we’ll create four models:
* **Interval(BaseModel):** represents an interval [a, b] of a mathematical function. It inherits from the `BaseModel` class.
* **Function(BaseModel):**, a generic representation of a mathematical function. It inherits from the `BaseModel` class.
* **Function2D(Function):** represents a 2-dimensional mathematical function. It inherits the attributes and functionalities from the `Function` class.
* **Function3D(Function):** represents a 3-dimensional mathematical function. It inherits the attributes and functionalities of the `Function` class.
The models diagram and their relationships are as follows:
<center>
</center>
Start by creating a file called `models` inside the directory `grafar-server`:
```shell
touch models.py
```
Import the libraries that we’ll be using:
```python
from typing import Any, Dict, List
import numpy as np
import sympy as sp
from pydantic import BaseModel
```
### Model 1: The Interval Model
The `interval` model represents an interval of a mathematical function: the value of the left end by `a` and the value of the right end by `b`.
```python
class Interval(BaseModel):
a: float
b: float
```
Wecan make use of our `interval` model by creating instances of it:
```python
interval_x = Interval(a=0, b=10)
```
### Model 2: The Function Model
The Function model represents a mathematical function in our system. It has the following attributes:
* `function`: the mathematical function represented as a string e.g. $x^2$
* `interval_x`: instance of the `Interval` class that defines the interval of values that we’ll use to evaluate the function.
* `points`: number of partitions we want to make within the interval.
* `mesh`: the mesh of the final values that will be plotted.
```python
class Function(BaseModel):
function: str
interval_x: Interval
points: int = 200
mesh: Dict[str, List[Any]] = {}
```
The `Function` model also has a series of functions that will be useful when creating the value grids. Here’s an example:
Initially, the user will ask to evaluate a function in a given interval. What happens if the user asks to evaluate $x^2$ in the interval $[0, 10000]$? Do we create a vector with points from 0 to 10000 with jumps of 1? And what if the user asks to evaluate it in the interval $[1, 2]$? Do we create a vector with only two points?
In order to avoid steps that are too big or too small, we can use a normalization method. The `get_step` function scales the number of steps to the size of the interval so we show a consistent number of line segments on the resulting graph.
```python
def get_step(self, interval: Interval):
return (interval.b - interval.a) / self.points.
```
In this code, something we'll do often is creating NumPy vectors which are required to make the function's domain. To avoid ending up with duplicate code, isolate the logic of these processes in the `get_vector` function.
```python
def get_vector(self, interval: Interval):
step = self.get_step(interval).
return np.arange(interval.a, interval.b + 1, step)
```
Another common task will be evaluating the values in a mathematical function. To isolate such logic, we'll want a constructor to take a collection of mathematical symbols that were parsed from user input and turn them into a SymPy function object.
```python
def create_function(self, symbols):
return np.vectorize(sp.lambdify(symbols, sp.sympify(self.function))))
```
### Model 3: The Function2D Model
The `Function2D` model abstracts the properties of a two-dimensional mathematical function. The `Function2D` class inherits from the `Function` class and adds methods to create two-dimensional meshes of values. The main purpose of the `Function2D` class is to create a two-dimensional value mesh for the $x$ and $y$ axes of the requested function.
```python
class Function2D(Function):
def __init__(self, *args, **kwargs):
super().__init__(*args, **kwargs).
def create_mesh(self):
vector_x = self.get_vector(self.interval_x)
vector_y = self.evaluate_function_2d(vector_x)
self.mesh = {
"x": vector_x.tolist(),
"y": vector_y.tolist()
}
def evaluate_function_2d(self, vector_x):
symbol_x, _ = self.get_symbols().
function_fx = self.create_function(symbol_x)
return function_fx(vector_x)
```
Let's take a look at the `create_mesh` method:
* `vector_x` creates a vector with the values for the $x$ axis in the interval `self.inverval_x`.
* `vector_y` creates the vector with the values for the $y$ axis based on the values of `vector_x`, this line makes use of the`self.evaluate_function_2d()` function, which we’ll detail later.
* `self.mesh` creates a dictionary with the values associated with the $x$ and $y$ axes of the function.
The `evaluate_function_2d()` method receives a vector as a parameter, with the values for the $x$ axis of the function, and returns a new vector with the values for the $y$ axis.
### Model 4: The Function3D Model
Similar to `Function2D`, the `Function3D` model abstracts the properties for a three-dimensional function. `Function3D` inherits the properties and methods of the `Function` class and adds new attributes and functionalities.
* `interval_y`: instance of the `Interval` class that defines the interval of values that we’ll use to evaluate the function for the variable $y$.
```python
class Function3D(Function):
interval_y: Interval
def __init__(self, *args, **kwargs):
super().__init__(*args, **kwargs).
def create_mesh(self):
vector_x = self.get_vector(self.interval_x).
vector_y = self.get_vector(self.interval_y)
vector_x, vector_y = np.meshgrid(vector_x, vector_y)
vector_z = self.evaluate_function_3d(vector_x, vector_y)
self.mesh = {
"x": vector_x.tolist(),
"y": vector_y.tolist(),
"z": vector_z.tolist()
}
def evaluate_function_3d(self, vector_x, vector_y):
symbol_x, symbol_y = self.get_symbols().
function_fxy = self.create_function((symbol_x, symbol_y))
return function_fxy(vector_x, vector_y)
```
## Step three: Add the services
Now that we have the models created and the business logic implemented, the only thing left to do is to expose the functions as services to be used by client applications. For this, we'll create two REST API endpoints that will serve as an entry point for users to evaluate the functions in the intervals required.
First, we'll create an endpoint to evaluate two-dimensional functions. This endpoint receives a Function2D as the body which is initialized with the function value and the interval.
Let's see an example of the POST API body:
```json
{
"function": "3*x+sin(x)",
"interval_x": {
"a": "-2",
"b": "5"
}
}
```
### The Function 2D Endpoint
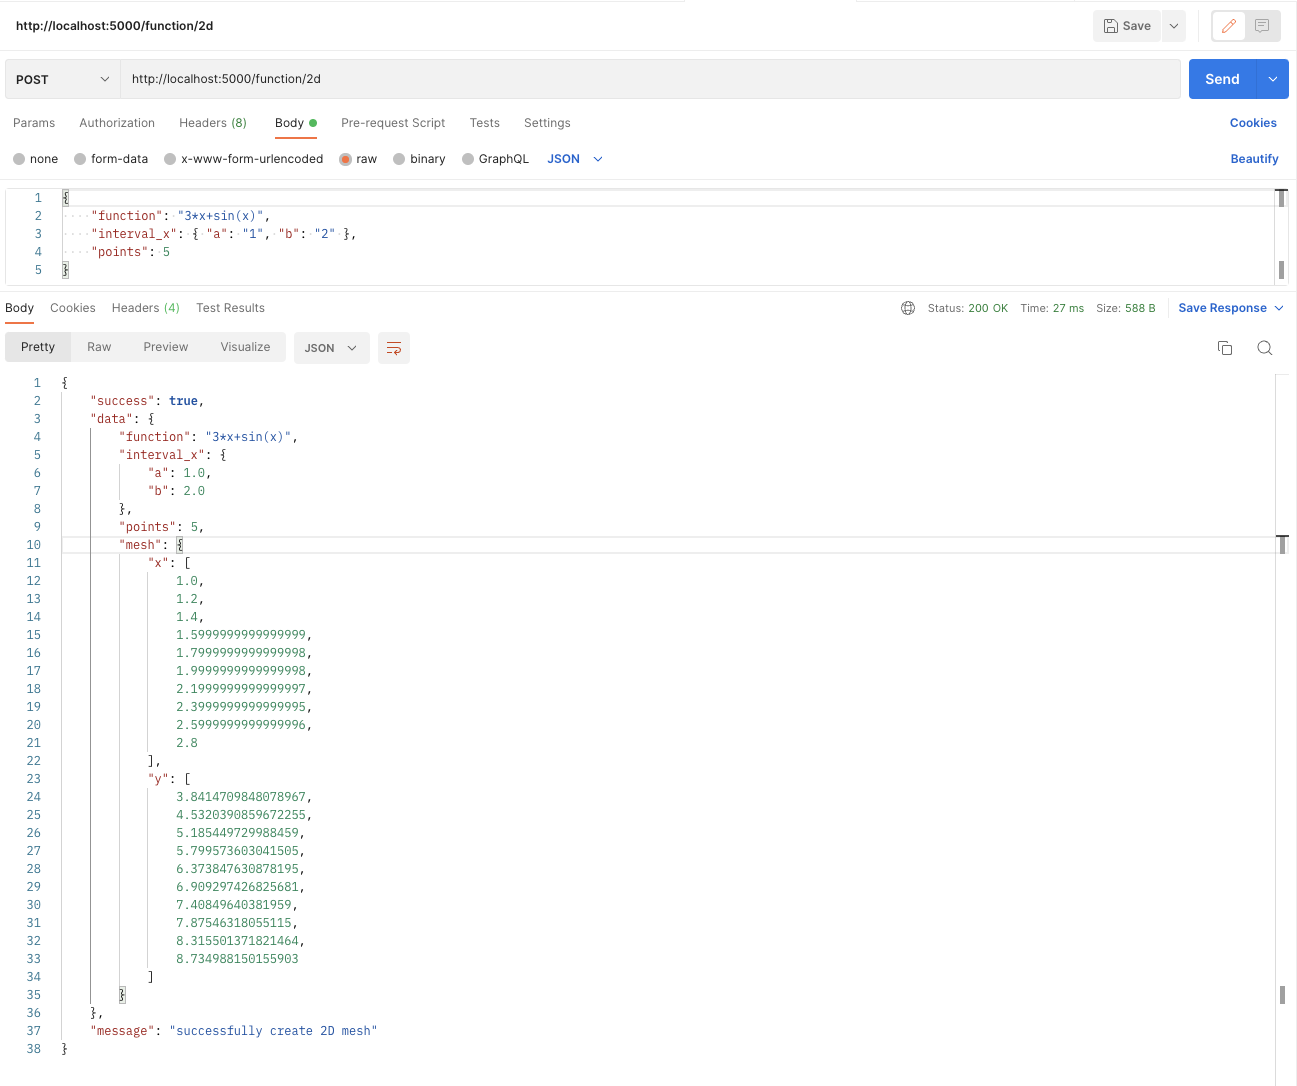
The `create_2d_function_mesh` function first calls the `create_mesh` function of the `function_2d` object, which is in charge of creating the mesh of values associated to the `function_2d.function` in the interval `[function_2d.interval_x.a, function_2d.interval_x.b]`. Finally it returns to the client a JSON that contains a boolean to indicate that the operation was successful, the information associated with the function and a successful response message.
```python
@app.post("/function/2d")
async def create_2d_function_mesh(function_2d: Function2D):
function_2d.create_mesh().
return {
"success": true,
"data": function_2d,
"message": "successfully create 2D mesh".
}
```
To verify that the endpoint is working correctly, let's perform an API test using *Postman*.
<center>
</center>
### The Function 3D Endpoint
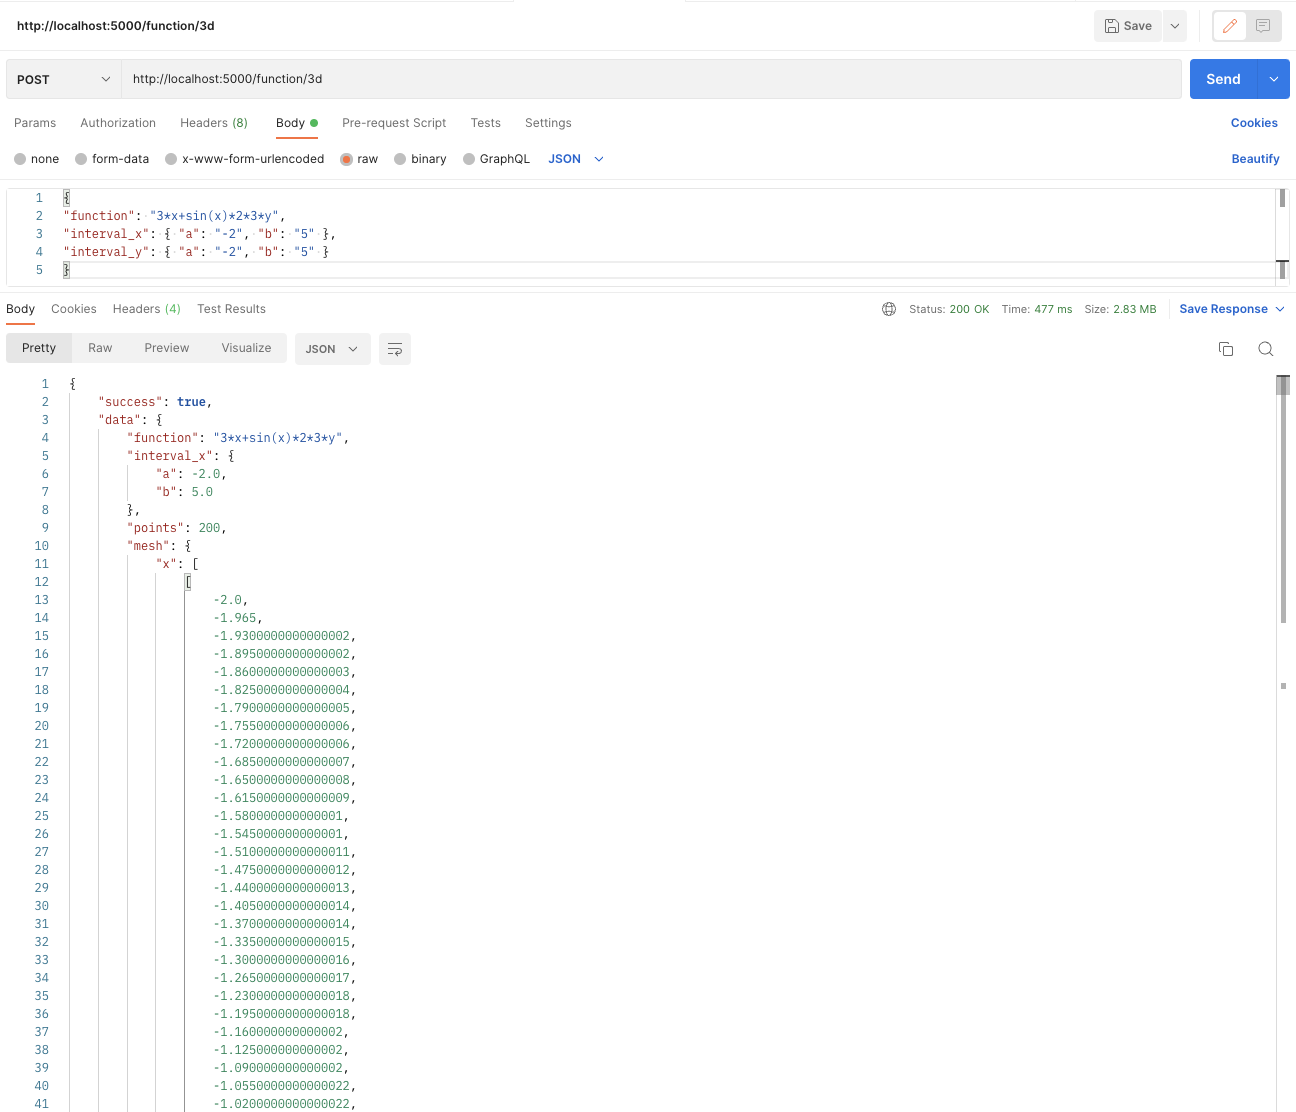
Finally we can add in a similar way a new endpoint to handle the function evaluation requests in two variables, for this we are going to create the `create_3d_function_mesh` function, which works in a similar way to `create_2d_function_mesh`, only that in this case evaluations are made to three-dimensional functions:
```python
@app.post("/function/3d")
async def create_3d_mesh_function(function_3d: Function3D):
function_3d.create_mesh().
return {
"success": true,
"data": function_3d,
"message": "successfully create 3D mesh"
}
```
Again we can verify with the help of postman that the endpoint is running.
<center>
</center>
## Conclusion
In this blog post, we resolved the portability and accessibility limitations associated with the Python script that I shared previously. Here’s a recap of what we did:
1. Created an Application Server Using *FastAPI*
2. Worked with *OOP* in Python to create the interval and function models
3. Created two REST API endpoints evaluate mathematical functions
After following these steps, we should now have developed a server to evaluate mathematical functions in two- and three-dimensions.
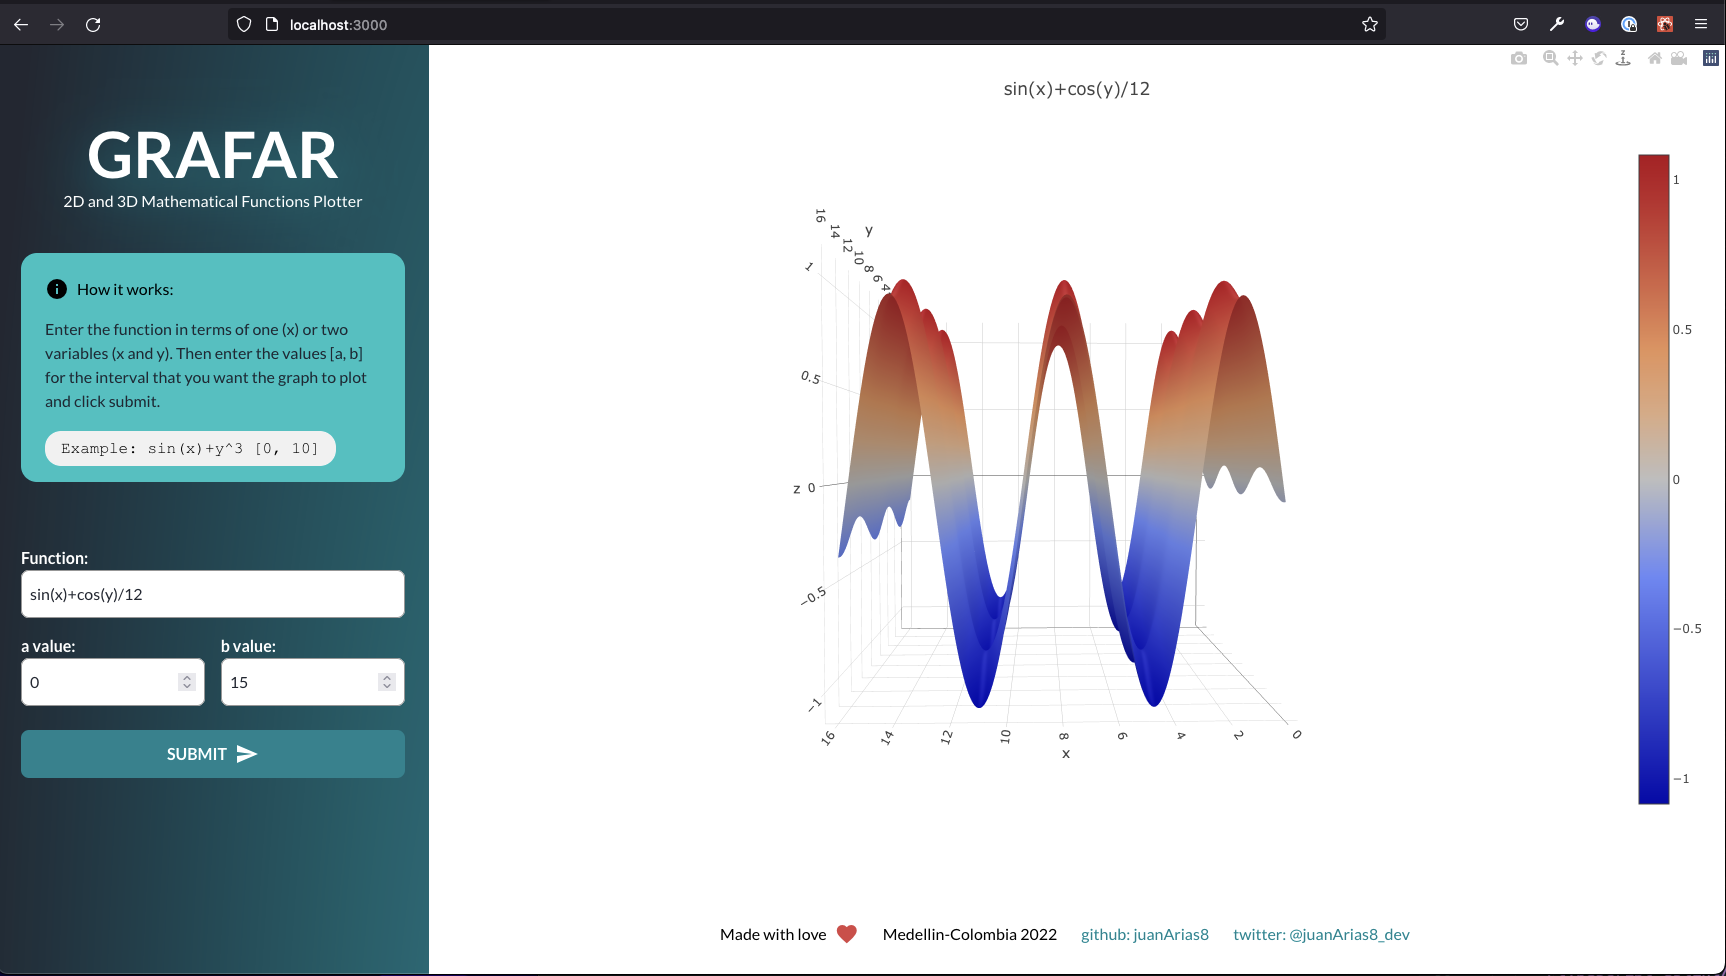
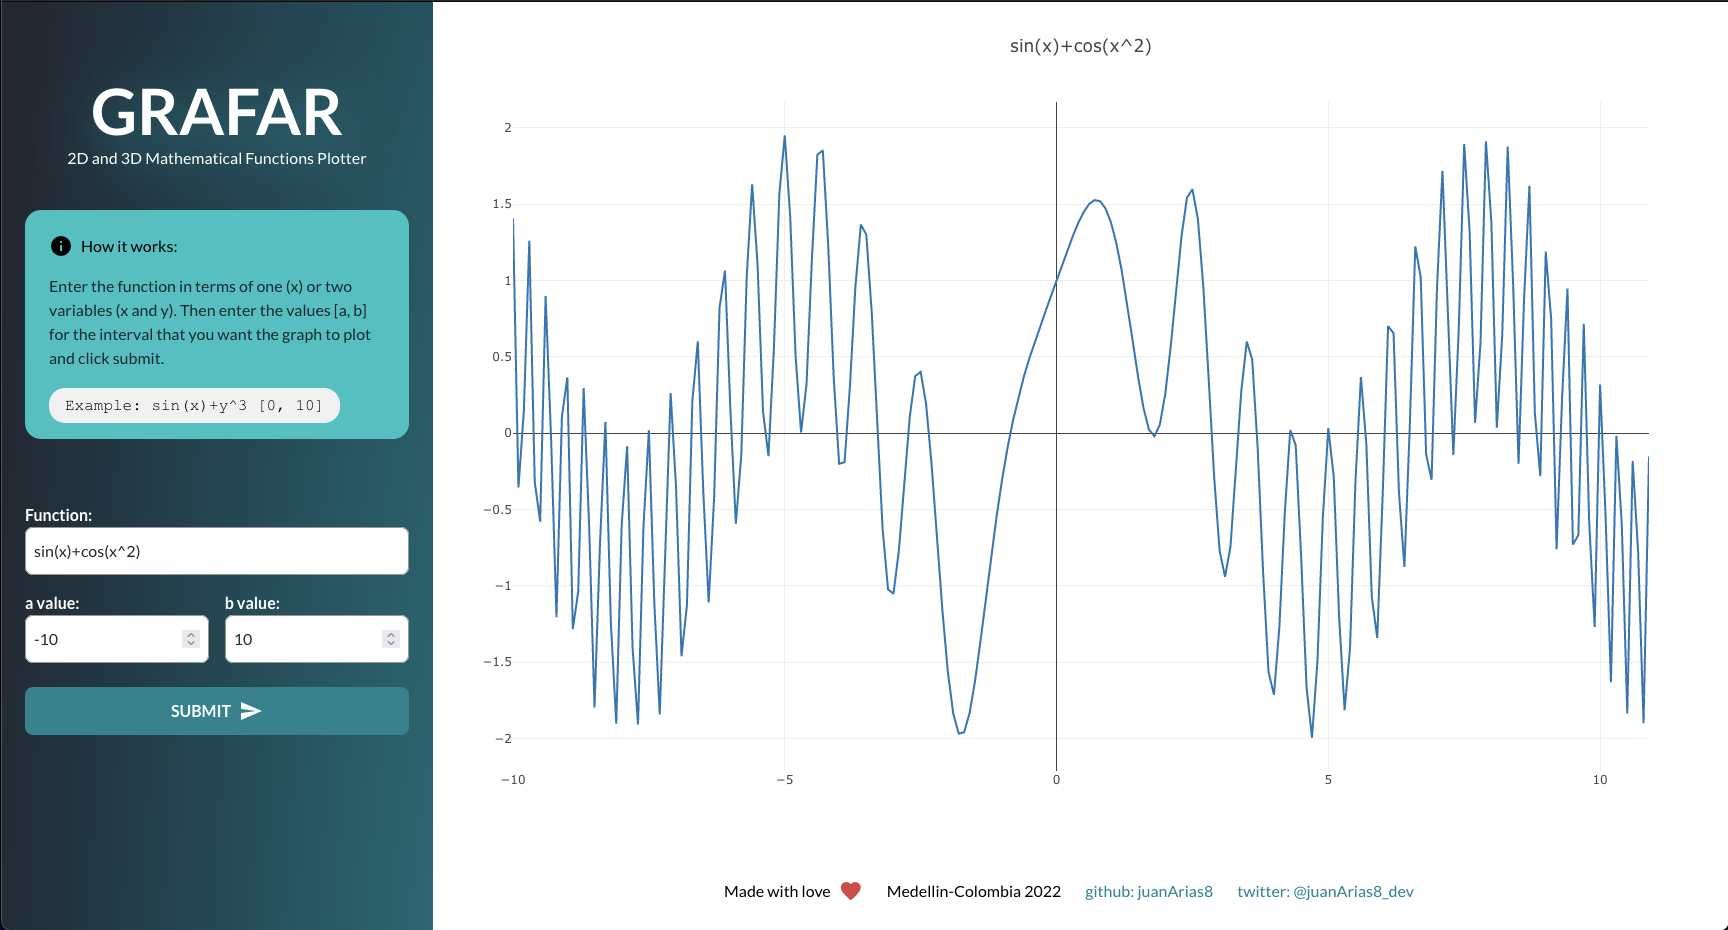
But we’re not done yet! Stay tuned for my next post where we’ll solve issues of display and interactivity limitations of the API server. We'll also look at how I built a web application in React using the PlotyJs visualization library. This web application is an interactive plotter called Grafar which allows users to plot two- and three-dimensionsional graphs.
If you want to see the results of my work in Grafar, please go to:
Github: https://github.com/juanArias8/GRAFAR
Here are some screenshots of the final web interactive plotter:
### Grafar web: two-dimensional graph
### Grafar web: three-dimensional graph